
Figure 3.
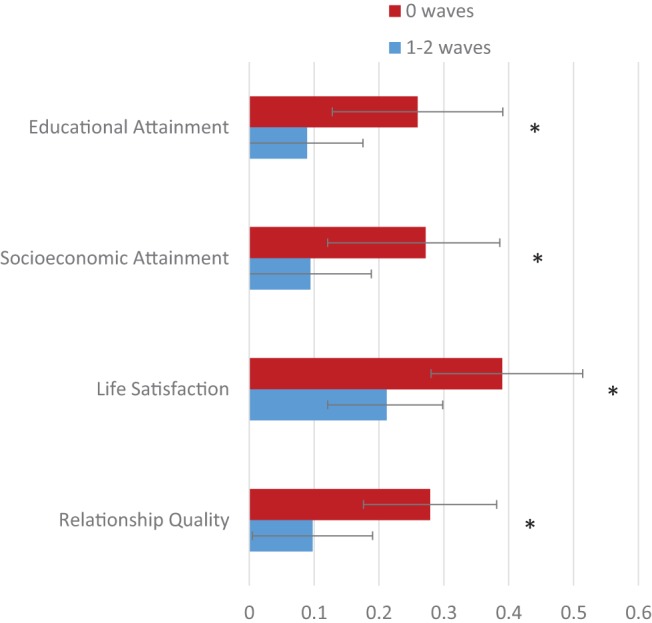
Comparison of midlife outcomes for Dunedin cohort members in the 0 wave versus 1–2 wave mental health history groups. Error bars represent 95% confidence intervals. All outcome variables were standardized on the full cohort to a mean of 0 (representing the mean of the full cohort) and a standard deviation of 1. The means for the persistently diagnosed group are not shown here, but can be found in Table 3 in the online supplemental materials. Asterisks represent the statistical significance of the difference between groups, adjusted for sex. * p < .05.