
Figure 3.
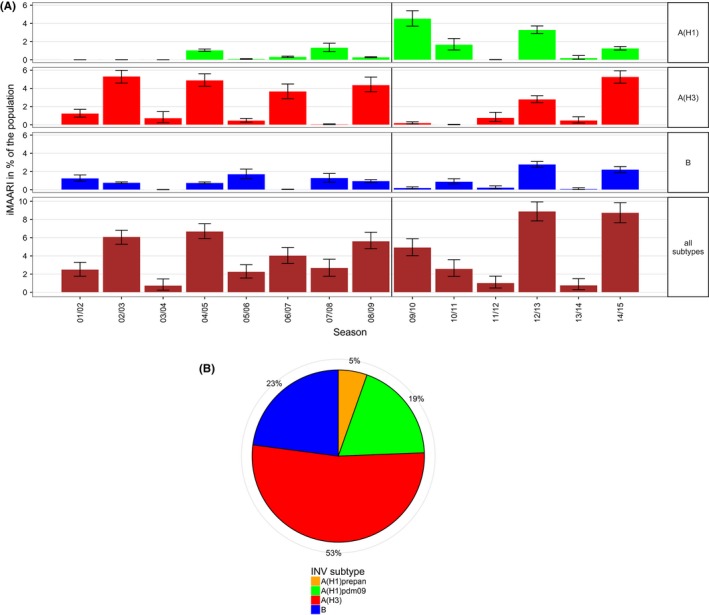
Top panel: estimated number of influenza‐attributable medically attended acute respiratory infections (iMAARI) by influenza type/subtype and season; green=A(H1) (pre‐pandemic A(H1) (A(H1)prepan) and A(H1)pdm09 not separated), red=A(H3), blue=B. Bottom panel: distribution of all iMAARI accumulated for all seasons from 2001/02 until 2014/15, by type/subtype. Colours denote influenza types and subtypes; in contrast to the top panel, A(H1)prepan (orange) and A(H1)pdm09 (green) are coloured separately