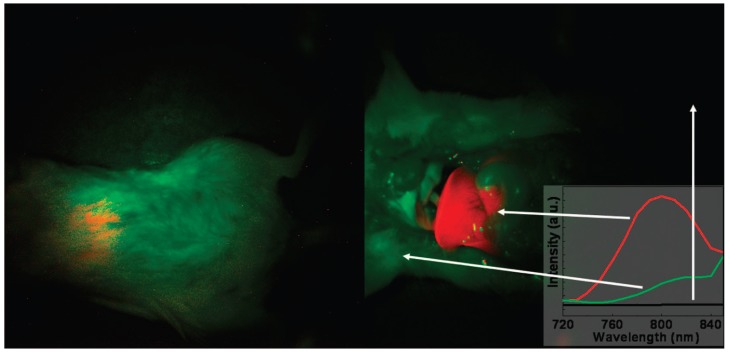
Figure 4.
In vivo imaging of a mouse with the injection of UCNPs: intact mouse (left); the same mouse after dissection (right). The red color indicates emission from UCNPs; green and black show the background, as indicated by the arrows. The inset presents the photoluminescence spectra corresponding to the spectrally unmixed components of the multispectral image obtained with the Maestro system. Adapted with permission from reference [78]. Copyright: American Chemical Society, 2008.

