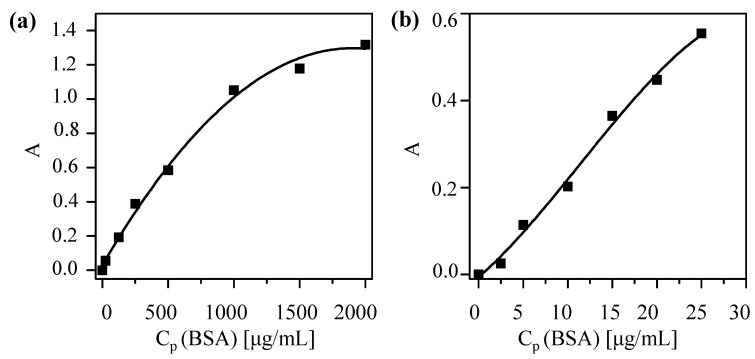
Figure 4.
Coomassie assay calibration curves to determine the protein concentration CP of solutions with (a) high concentration and (b) low concentrations by measuring the offset-corrected absorption A at 595 nm. The fitting curves are (a) A(CP) = 0.029 + (0.001 mL/μg)·CP − (3 × 10⁻⁷ mL2/μg2)·CP2, and (b) A(CP) = −0.005 + (0.017 mL/μg)·CP – (6.789 × 10⁻⁴ mL2/μg2)·CP2 – (1.97 × 10⁻⁵ mL3/μg3)·CP3 and the coefficients of determination (r2) are equal to 0.994 and 0.989, respectively.

