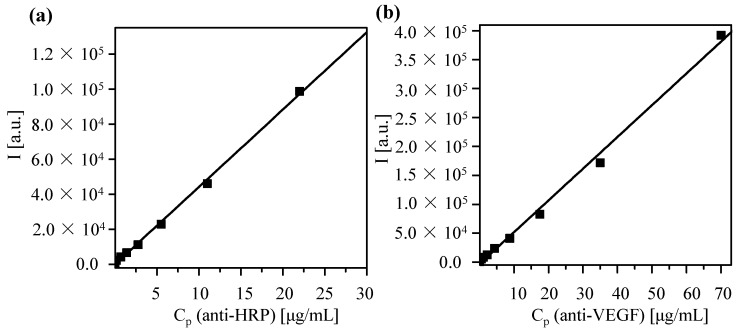
Figure 5.
Calibration curve in which the fluorescence intensity I at 519 nm is determined for protein solutions of different concentration CP. Data are shown for antibodies against (a) horseradish peroxidase (HRP) and (b) vascular endothelial growth factor (VEGF). A linear fit leads to the following correlation between fluorescence intensity I and concentration CP: (a) I(CP) = I0 + (ΔI/ΔCP)·CP = −464.28 + (4447.1 mL/µg)·CP; (b) I(CP) = −3549.4 + (5498.3 mL/µg)·CP. The coefficients of determination (r2) are equal to 0.998 and 0.995 for HRP and VEGF, respectively.

