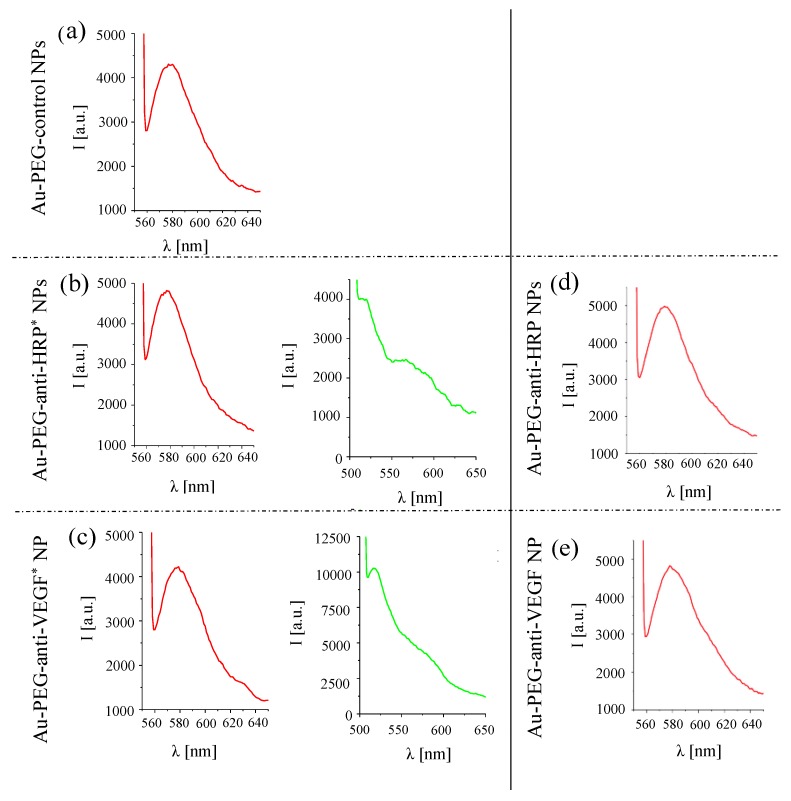
Figure 7.
Left side: Fluorescence spectra recorded for (a) Au-PEG-control NPs, (b) Au-PEG-anti-HRP* NPs, and (c) Au-PEG-anti-VEGF* NPs at a NP concentration of cNP = 2 nM. Excitation was performed at 545 nm (TAMRA, drawn in red) or at 494 nm (FITC, drawn in green). Fluorescence spectra were recorded under the same conditions as the spectra recorded for the calibration curve Figure 5. Right side: Fluorescence spectra recorded for (d) Au-PEG-anti-HRP NPs, and (e) Au-PEG-anti-VEGF NPs for TAMRA excitation (545 nm) at a NP concentration of cNP = 2 nM.

