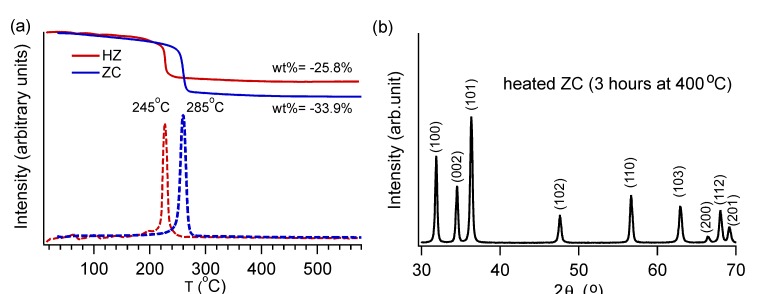
Figure 4.
(a) ZnCO3 (ZC, blue) and Zn5(CO3)2(OH)6 (HZ, red) show one-step decomposition toward the formation of ZnO. The mass loss curves are shown as solid lines, and their derivatives are shown as dashed lines; (b) The decomposition products match ZnO (JCPDS 36-1451). The representative data shown here are for the product from ZC decomposition.

