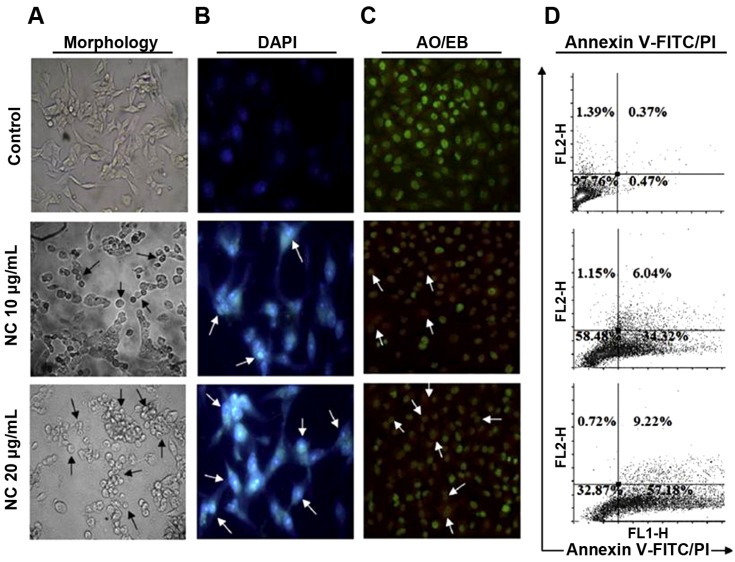
Figure 2.
(A) Morphological changes of nano-chelidonines (NCs) (10 and 20 µg/mL)-treated HepG2 cells observed by phase contrast microscope; (B) nuclear condensation assessment of control and treated cells by DAPI staining were analyzed through fluorescence microscopy; (C) the increased apoptotic cells were determined by AO/EB staining through fluorescence microscopy. The nuclear condensation and transformation of color green to reddish orange with fragmented nuclear membrane represents the induction of apoptosis in the treated cells with respect to control ones; (D) assessment of cellular apoptosis by externalizing phosphatidyl serine through Annexin V/PI assay by flow-cytometric analysis. Reprinted with permission from [34]. Copyright 2013, Elsevier.

