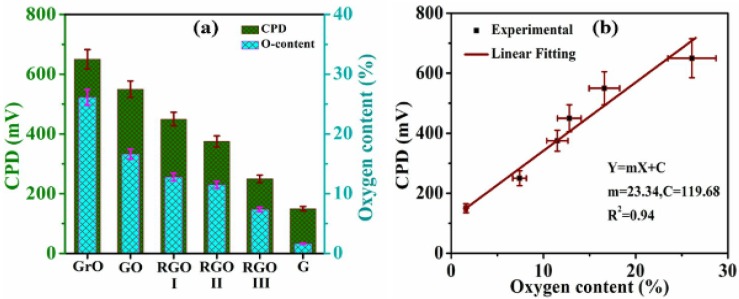
Figure 7.
(a) Bar graph of contact surface potential difference (CPD) as a function of oxygen content at different stages in graphene synthesis; and (b) Linear fitting of CPD variation during decreasing oxygen content at different stages from graphite oxide to graphene. Reprinted with permission from [119]. Copyright 2013 American Chemical Society.

