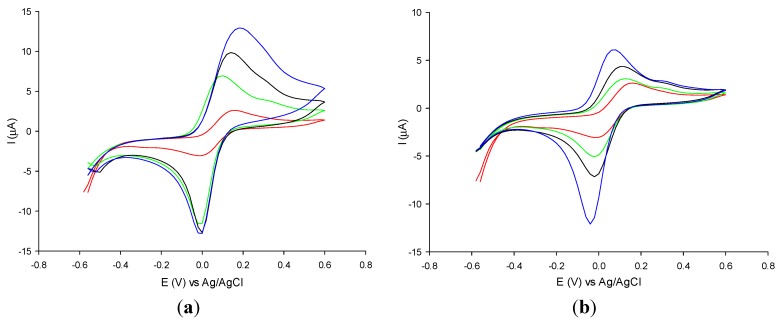
Figure 2.
Cyclic voltammograms of 0.1 mM potassium ferricyanide solution at unmodified multi-wall-carbon-nanotubes (MWCNTs) (red curve) and at MWCNTs modified with AuNPs of 5 nm diameter (Figure 2a) and of 10 nm (Figure 2b) at the following concentrations: 7 × 10⁻⁴ M (green curve), 1 × 10⁻³ M (black curve), 1.4 × 10⁻³ mM (blue curve). Experimental conditions: 0.1 M phosphate buffer pH 7; scan rate 5 m·Vs−1.

