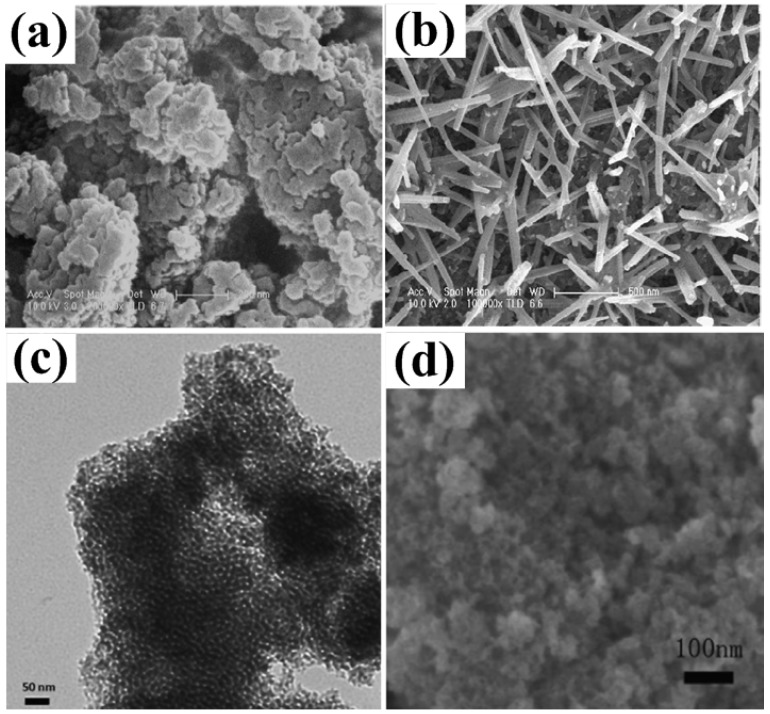
Figure 4.
Scanning electron microscopy (SEM) images of MnO2 samples synthesized by sonochemical method with two different amplitudes: (a) 30 μm; (b) 60 μm [34]. Transmission electron microscope (TEM) (c) and SEM (d) images of mesoporous MnO2 synthesized through the reaction of potassium permanganate and ethanol under ultrasound irradiation [19].

