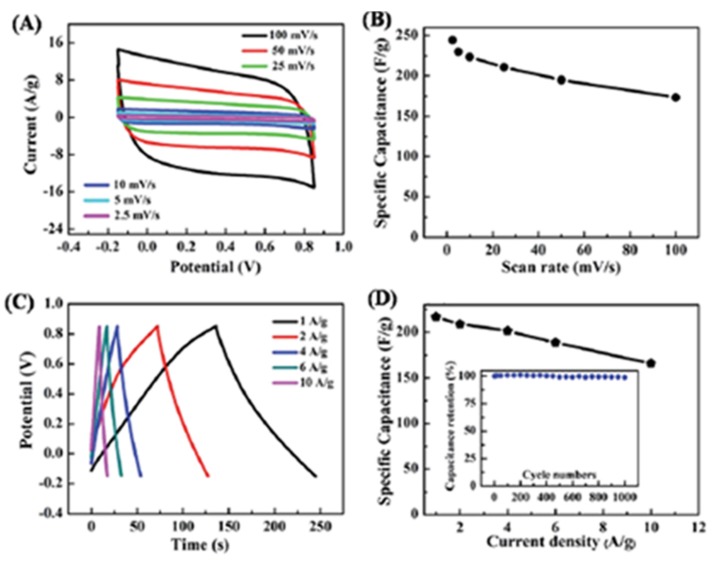
Figure 9.
Electrochemical characterization of G/SWCNHs in 1 M KOH aqueous solution at room temperature. (a) CV curves at different scan rates. (b) Specific capacitance versus scan rate. (c) GCD curves at different current densities ranging from 1 A·g−1 to 10 A·g−1. (d) Specific capacitance as a function of current density; inset shows capacitance retention versus cyclic number. Reproduced with permission of [81]. Royal Society of Chemistry, 2015.

