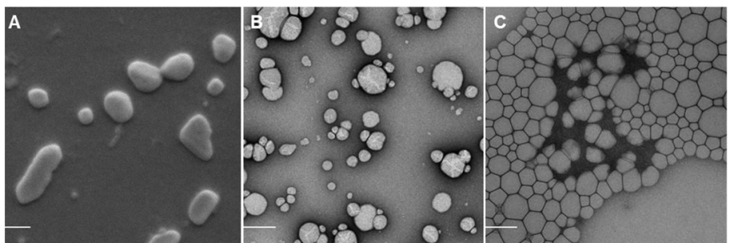
Figure 1.
Scanning electron microscopy (SEM) images of plain TMC nanoparticles alone (a) and loaded with pDNA (A), transmission electron microscopy (TEM) images of SWE06 alone (b) and loaded with pDNA (B), and TEM images of Cationorm® alone (c) and loaded with pDNA (C). The scale bars represent a size of 200 nm.


