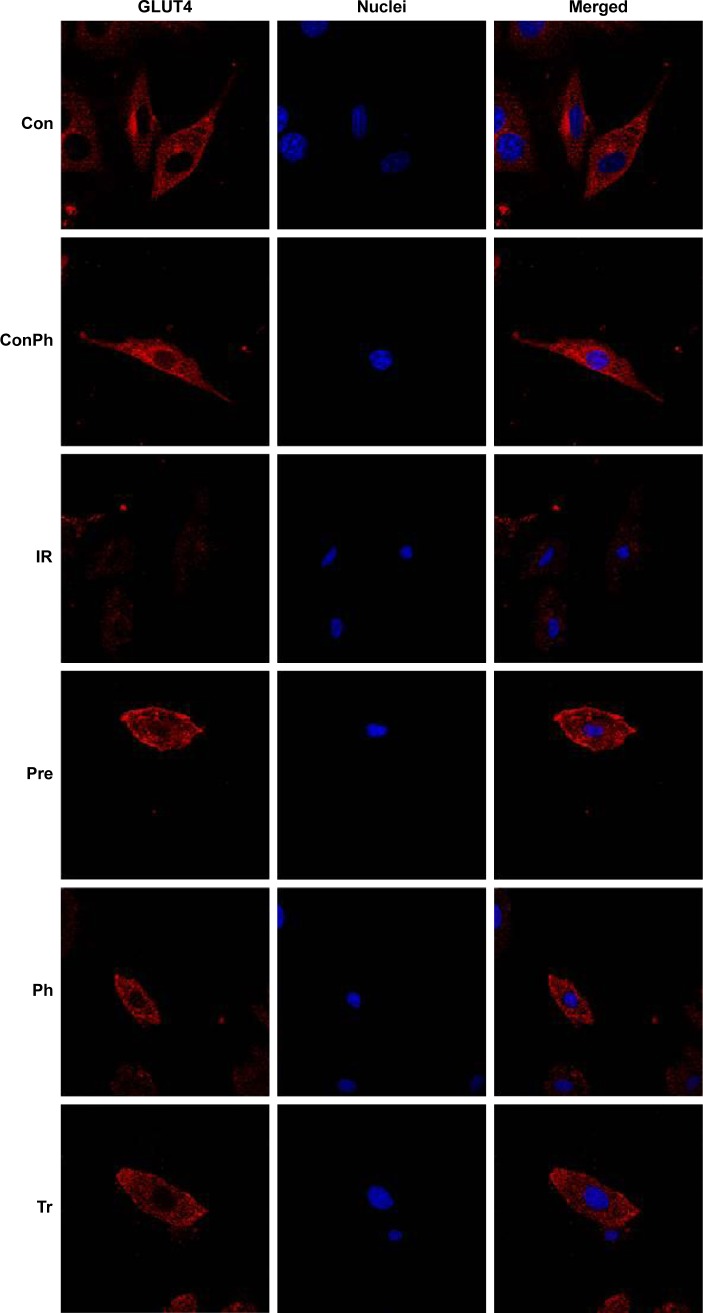
Figure 8.
Effects of Ph and metformin on expression of GLUT4 in L6 myotubes.
Notes: L6 myotubes were stained for GLUT4 with Cy3 (red) and nuclei were stained with Hoechst 33342 (blue). The merged images showed that Ph and metformin led to an increase of the GLUT4 expression compared with the IR group. Ph also promoted translocation of GLUT4 to cell membrane.
Abbreviations: Ph, phloretin; IR, insulin resistance; Tr, treat group; Con, control group; ConPh, control + phloretin group; GLUT4, glucose transporter; Pre, prevention group.

