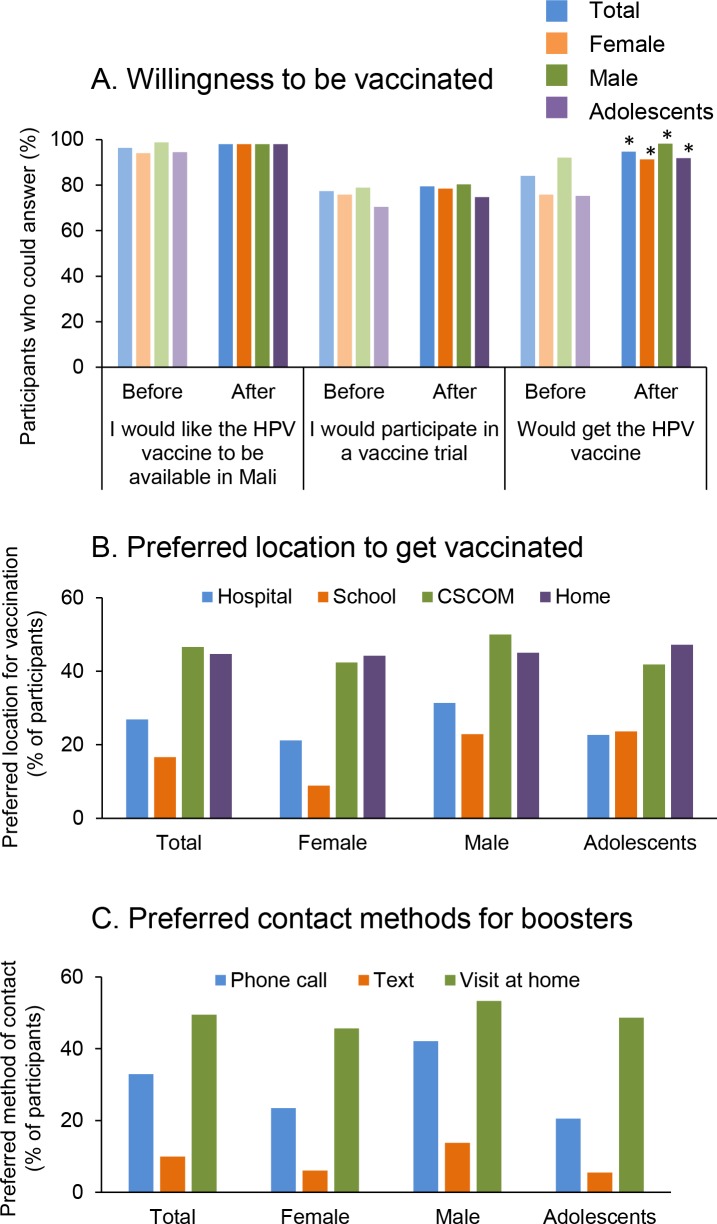
Fig 3. Willingness to be vaccinated against HPV and immunization preferences.
A. Willingness to participate in a vaccine trial and to get vaccinated was assessed before and after the educational session for all participants (Total, N = 301), female (N = 149), male (N = 152) and adolescents (N = 146). * p<0.01 and ** p<0.05 when compare to answers before the educational session (McNemar test). B, C: The preferred location to get the vaccine and the preferred method of contact for booster was assessed among participants who would choose to get vaccinated (Total, N = 253; Female, N = 113; Male, N = 140, Adolescents, N = 110). Interest in vaccination was high, two locations were preferred (local clinics (CsCOMS) and at home), and home visits rather than phone messages were preferred for reminders.

