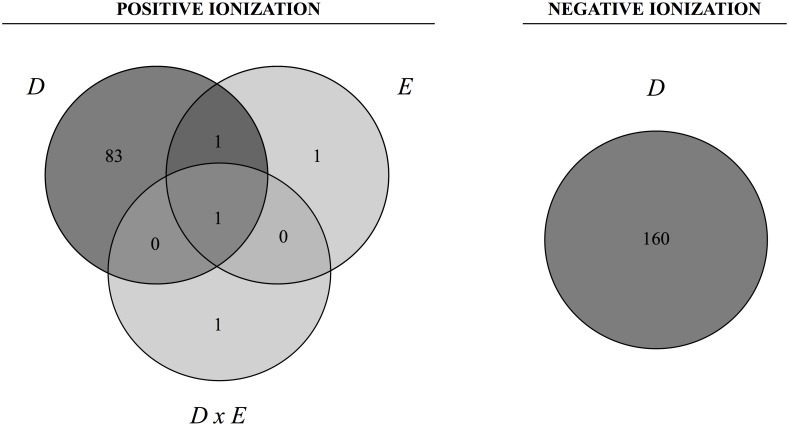
Fig 4. Venn diagrams showing the number of significant entities from each experimental parameter.
Data from each ionization mode, positive and negative, were analysed using two-way ANOVA. To handle false discovery rates from multiple comparisons, the cut-off point for significance was calculated according to the Benjamini-Hochberg correction at a level of 5%. D: the effect of diet; E: the effect of exercise; DxE: the interaction between the two main factors. The areas where the circles overlap show the number of significant entities shared by the parameters.

