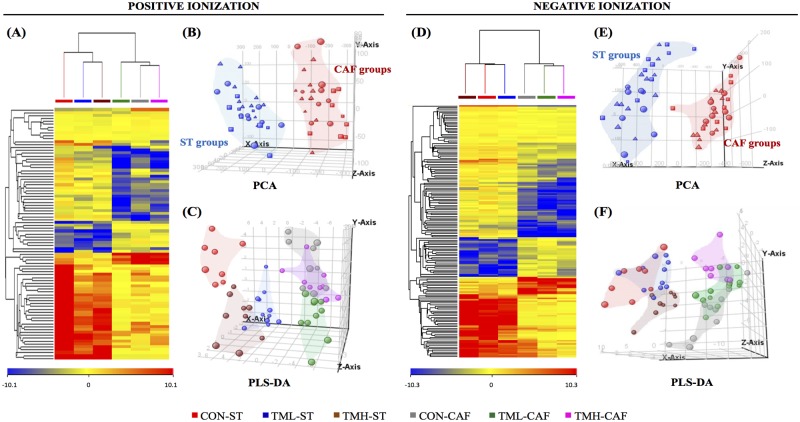
Fig 5. Multivariate analysis demonstrating the effect of diet and physical exercise on the animal metabolome.
Serum extracts were analysed using LC-ESI-MS in both positive and negative ionization modes. (A, D) Heat map representations of hierarchical clustering of significant entities found in each group of animals. Each row represents an exact mass coloured by its abundance intensity, normalized to an internal standard and baselined to the mean of all samples. The scale from -10 (blue) to +10 (red) represents this normalized abundance in arbitrary units. The PCA (B, E) and PLS-DA (C, F) graphs show that the effect of cafeteria diet had prevalence over the periodic training on the treadmill at diverse intensities. Abbreviations: ST, standard chow; CAF, cafeteria diet; CON, control animals; TML, treadmill-low intensity runners; TMH, treadmill-high intensity runners.

