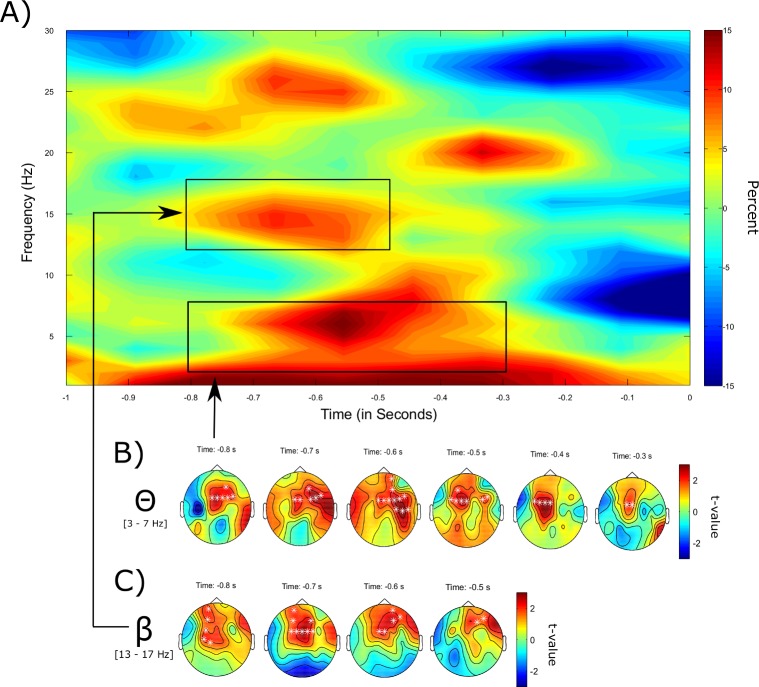
Fig 3. Pre-stimulus SMEs for the item memory for visually presented words.
(A) Time-frequency illustration of the pre-stimulus SME for written words. Plotted is the percentage change between successful and failed retrieval averaged across all frontal, temporal, and central electrodes. (B) Depicted is the topographical distribution of the significant clusters in the theta frequency band (3–7 Hz) over time with significant data points being marked by a white * (p = .031, one-sided). (C) Topographical distribution of the significant clusters in the beta frequency band (13–17 Hz) over time (p = .01, one-sided).

