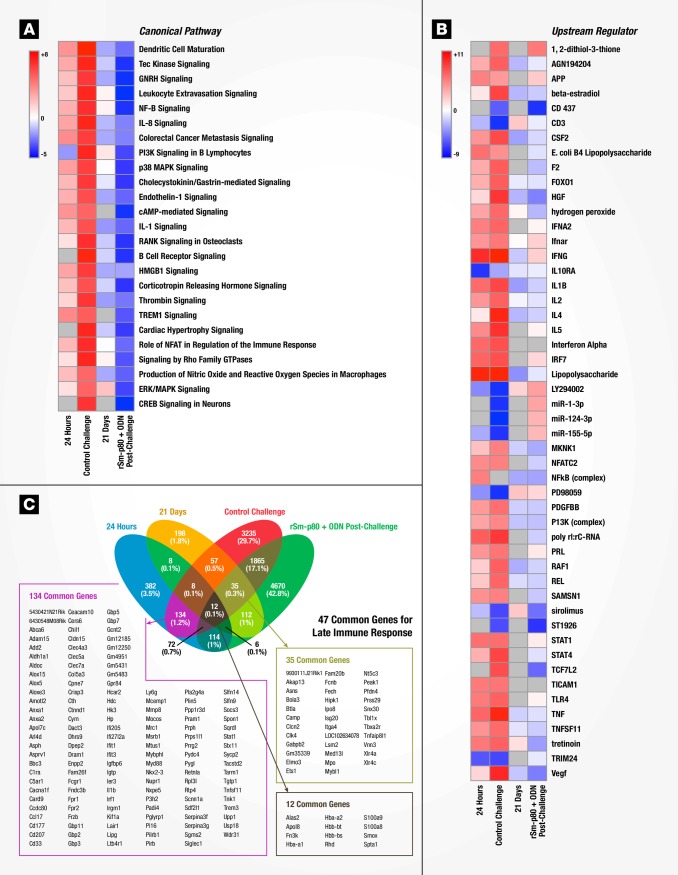
Fig 4. Molecular signatures of immune responses to vaccination with rSm-p80 + ODN compared to wild type Schistosoma mansoni infection.
(A) Top 25 identified canonical pathways. Predicted activation status (z-score) for a given pathway is represented as red (activation) or blue (inhibition). (B) Top 50 identified upstream regulators with predicted z-score of activation. (C) Venn diagram of shared genes across datasets.

