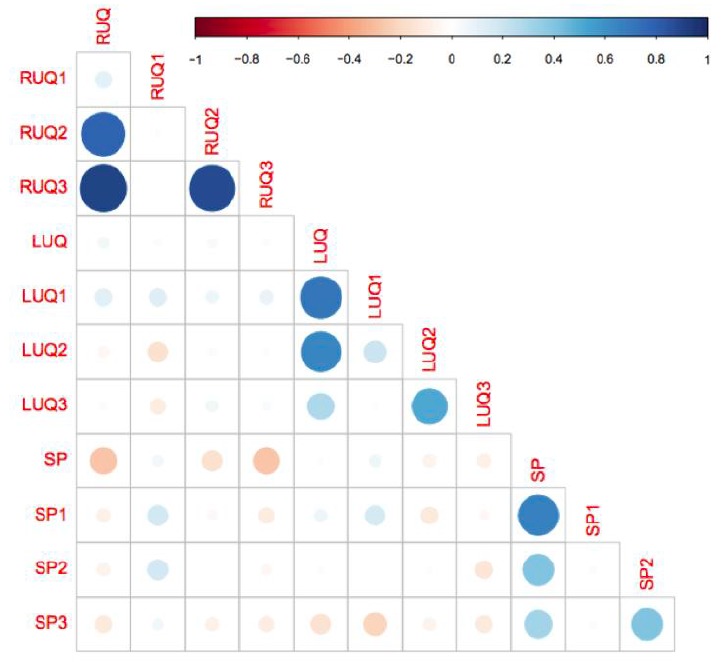
Figure 11.

This matrix gives the correlation coefficient between pairs of quadrants and sub-quadrants using Cohen’s kappa. The kappa coefficient measures inter-rater agreement between qualitative (categorical items). Values of kappa range from −1 (indicating total disagreement) to 1 (indicating total agreement). In this plot, the size and color (redness/blueness) of the dots corresponds to the degree of positive or negative correlation. Hence, the small light dots have a correlation nearer zero, i.e., no discernable correlation. The darker larger more saturated dots have a correlation nearer 1 (blue) or −1 (red) meaning a stronger correlation. LUQ1 appears to be the most consistent with other quadrants, while SP3 is the most in disagreement. RUQ1 is sub-quadrant with the least in agreement with its containing quadrant (RUQ).
LUQ, left upper quadrant; LUQ1, spleno-diaphragmatic space; LUQ2, spleno-renal space; LUQ3, inferior pole of the left kidney; RUQ, right upper quadrant; RUQ1, hepato-diaphragmatic space; RUQ2, hepato-renal space; RUQ3, caudal edge of the liver; SP, Supra-pubic; SP1, lateral on either or both sides of bladder; SP2, posterior to bladder and anterior pelvic organs; SP3, posterior to uterus, or pelvic cul-de-sac.
