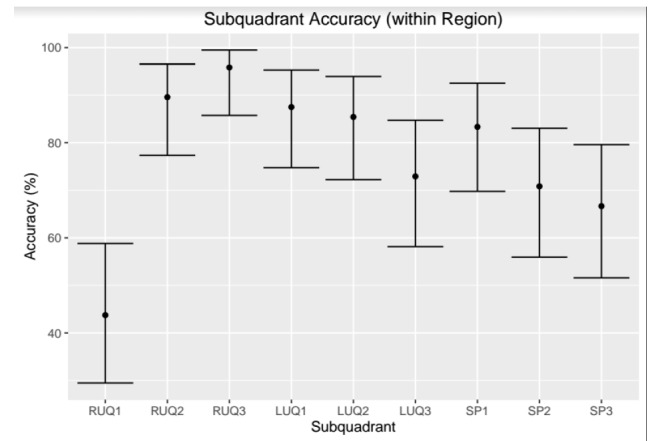
Figure 12.

This plot gives the accuracy of each sub-quadrant in predicting the assessment from the corresponding full quadrant. Error bars describe the 95% confidence interval around the accuracy determined using the method of Clopper and Pearson. As depicted, the RUQ3 is the most accurate predictor of the RUQ.
LUQ, left upper quadrant; LUQ1, spleno-diaphragmatic space; LUQ2, spleno-renal space; LUQ3, inferior pole of the left kidney; RUQ, right upper quadrant; RUQ1, hepato-diaphragmatic space; RUQ2, hepato-renal space; RUQ3, caudal edge of the liver; SP, Supra-pubic; SP1, lateral on either or both sides of bladder; SP2, posterior to bladder and anterior pelvic organs; SP3, posterior to uterus, or pelvic cul-de-sac.
