
Figure 4.
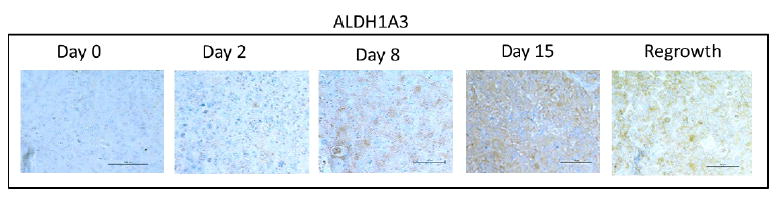

A: Immunohistochemical analysis of ALDH1A3 expression in xenograft tissues prior to and at the indicated timepoints after docetaxel treatment. Images were acquired using a 20X objective.
B: Quantification of percent of cells positive for moderate to strong staining of ALDH1A3 in five 20X fields. n=3 mice per time point. Error bars represent 95% confidence interval. Asterisk represent a significant **p<.005, ***p<.001.