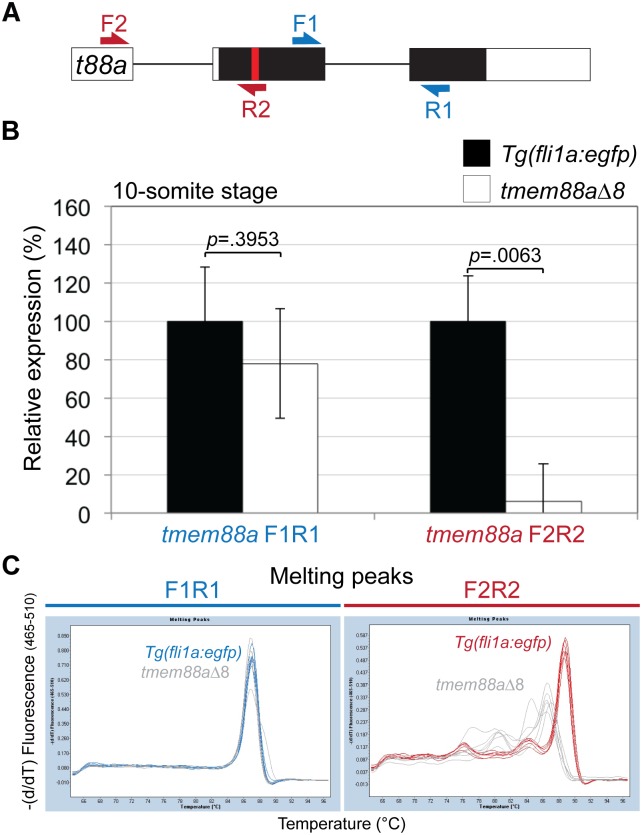
Fig 3. The expression of tmem88a in tmem88Δ8 mutant embryos.
(A) Schematic representation of the tmem88a (t88a) mRNA transcript. Non-coding and coding exons are shown as white and black blocks respectively. Introns as depicted as solid lines. The deleted site in tmem88aΔ8 mutants is shown by a red bar. F1R1 primers detected tmem88a transcript and F2R2 primers detected wild type transcript only. (B) qRT-PCR showing the expression of tmem88a in tmem88Δ8 mutants compared to Tg(fli1a:egfp) controls at the 10-somite stage using both primer sets. P-values determined by Unpaired Student’s t test. Error bars show the standard deviation for three biological replicates. (C) Melting curves using two primer sets designed for tmem88a detection as shown in (A). A shift in melting in temperature is observed in primers designed to bind the mutated region in tmem88aΔ8 mutants compared to controls (F2R2, green).

