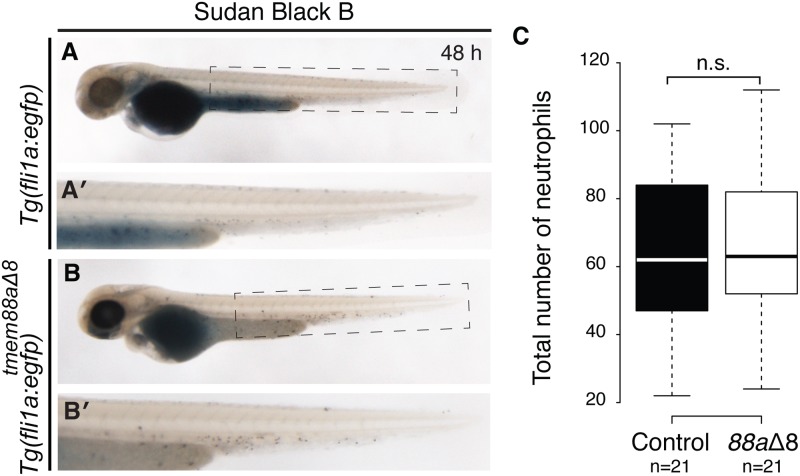
Fig 6. Myelopoiesis was not affected in tmem88aΔ8 zebrafish mutants.
(A-B) Sudan Black B staining of neutrophils at 48 hpf in Tg(fli1a:egfp) controls (A, n = 21), with the highlighted tail region magnified (A′) and tmem88aΔ8 mutants (B, n = 21), magnified in (B′). (C) The number of neutrophils was counted for each condition represented in a Tukey box and whisker plot. Neutrophil numbers were not significantly changed between the two groups (p = 0.6769, Unpaired Student’s t test). A, anterior; h, hours post fertilisation; D, dorsal; n.s., not significant.

