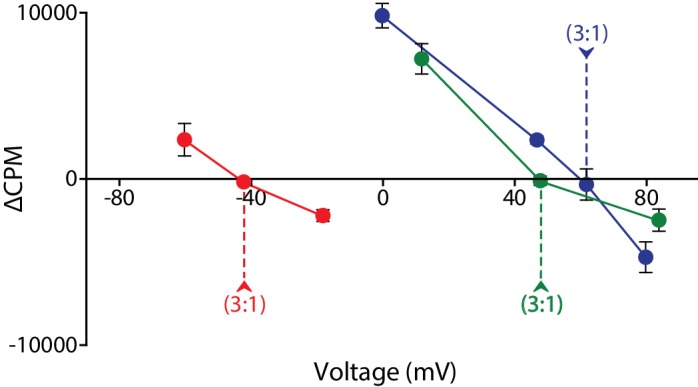
Figure 4. Voltage-ΔCPM plot of VcINDY transport for three different sets of substrate and coupling ion gradients.
ΔCPM for three sets of gradients plotted as a function of voltage. ΔCPM values were calculated by subtracting the CPM at 1 min (green and blues traces) and 30 s (red trace) from the initial counts for each voltage tested (Green data from Figure 2, Blue data from Figure 3, Red data from Figure 3—figure supplement 1). The reversal potentials for each gradient set are indicated by the dashed line and each represents a 3:1 coupling stoichiometry. Triplicate data sets are shown and error bars represent S.E.M.

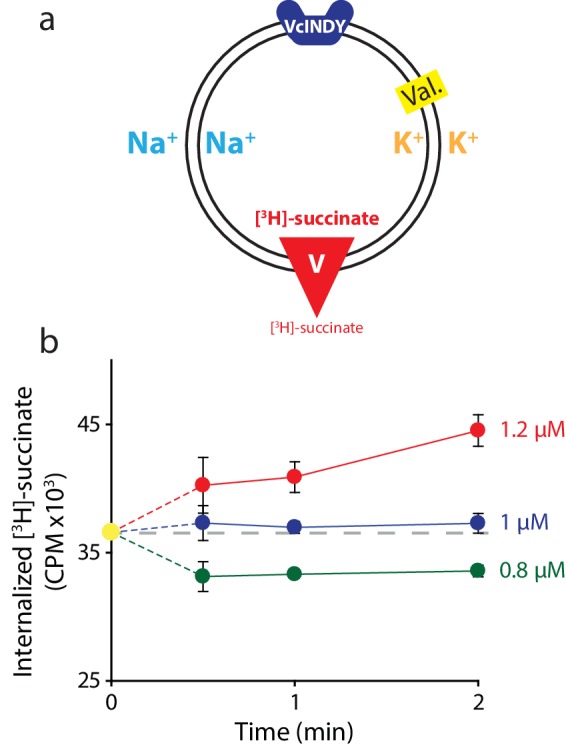
Figure 4—figure supplement 1. Determining the internal concentration of succinate using flux equilibrium.

