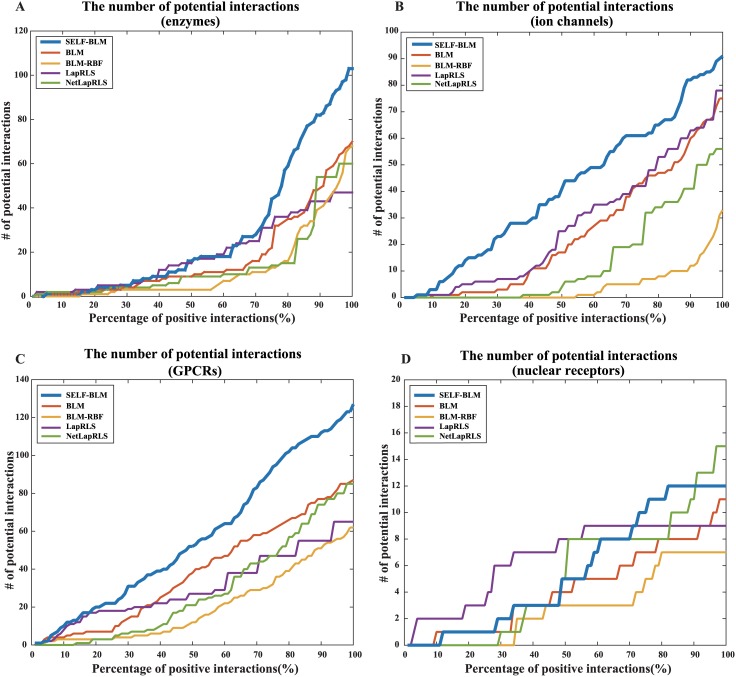
Fig 4. The number of potential interactions found by each method.
X-axis represents the accumulated percentage of positively predicted interactions in each method, y-axis represents the number of correctly predicted potential interactions. A) The number of potential interactions according to type of enzyme. B) The number of potential interactions according to type of ion channel. C) The number of potential interactions according to type of GPCR. D) The number of potential interactions according to type of nuclear receptor.

