. 2017 Jan 21;6:e21477. doi: 10.7554/eLife.21477

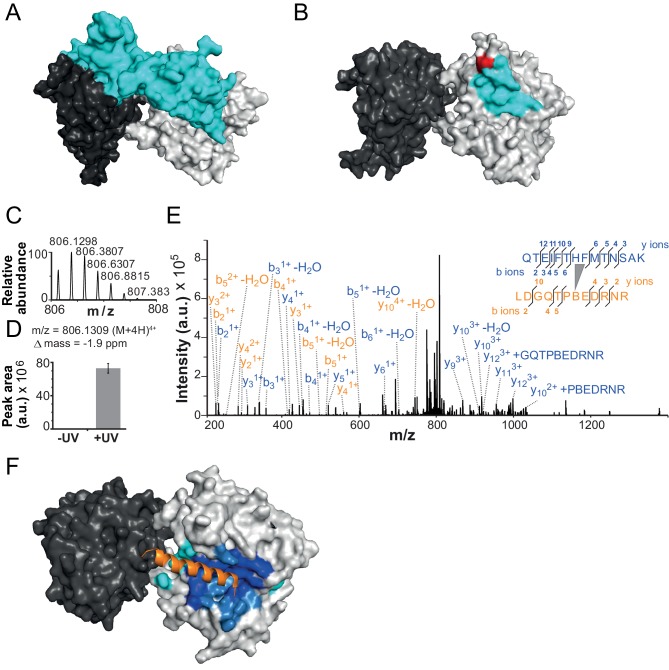
Figure 4. The NTR contacts Lobe 2 of the ATPase domain.

(A) Surface representation of the Chd1 crystal structure (PDB code 3MWY) (Hauk et al., 2010). ATPase Lobe 1 and 2 are colored dark and light grey, respectively, and the N-terminal chromo domains cyan. (B) Homology model of the ISWI ATPase domain (Forné et al., 2012). Cyan: hypothetical binding interface of the ISWI NTR (see main text), red: position of Bpa substitution (H483). (CE) Mass spectrometric validation of the crosslink XL1 (Table 1) formed between Bpa at position 483 and an NTR peptide. (C) Isotopic distribution of the crosslinked peptide. (D) UV-dependent increase of the signal for the crosslinked peptide. Extracted ion chromatograms of the ions were used for the quantification. (E) High resolution, high accuracy MS2 fragmentation spectrum. Top right: summary of observed product ions mapped onto the sequence of the crosslinked peptide. B: Bpa. (F) Predicted docking interface of AcidicN (blue and dark blue), AutoN (cyan and dark blue) and overlapping regions (dark blue) in the structural model of ISWI. The predicted interface for AcidicN overlaps with the interface for the acidic helix of the N-terminal chromo domains of Chd1 (orange) (Hauk et al., 2010).

DOI: http://dx.doi.org/10.7554/eLife.21477.011

Figure 4.

Figure 4—figure supplement 1. The effect of the H483B mutation on chromatin remodeling.
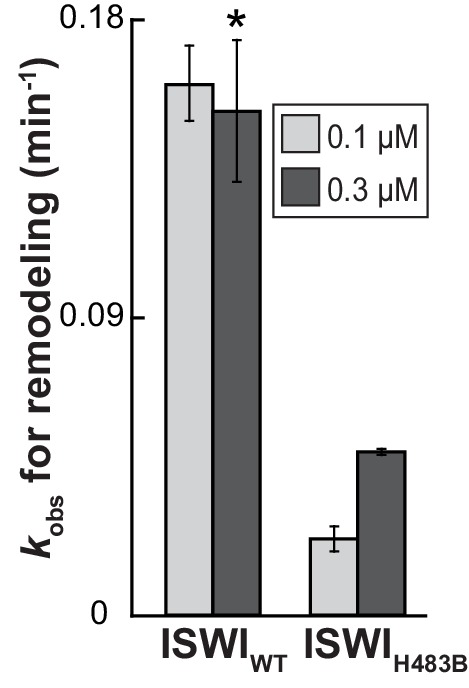
Figure 4—figure supplement 1.

With 0.3 µM enzyme, the observed rate constant for remodeling (kobs) was ~threefold affected by the mutation. Note, however, that ISWIH483B, in contrast to ISWIWT, was not fully saturating at this concentration, as suggested by the saturation control (0.1 µM enzyme). Error bars are s.d. (n ≥ 3) for ISWIWT and minimal and maximal values of two independent measurements for ISWIH483B. Data marked with an asterisk (*) was replotted from Figure 3C.
Figure 4—figure supplement 2. Validation of additional crosslinks detected in the ISWIH483B dataset.

Figure 4—figure supplement 2.

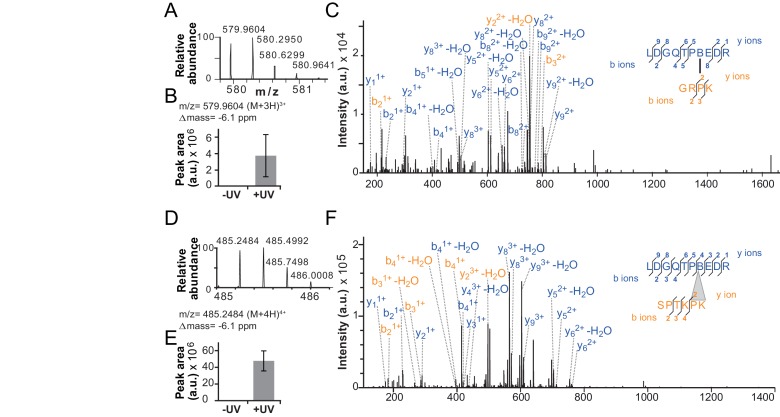
(AC) Crosslink XL7 (Table 1) to P75. (DF) Crosslink XL6 to P71K72. For description of data, see Figure 4.
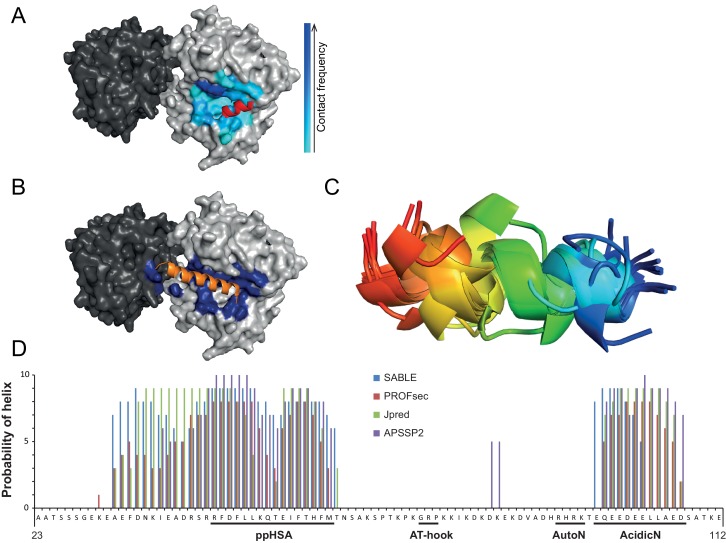
Figure 4—figure supplement 3. Structural predictions of NTR elements.

Figure 4—figure supplement 3.

(A) Predicted docking interface of AcidicN. The cyan to blue color scale denotes low to high contact probabilities. The location of AcidicN in the MtISWI crystal structure (PDB 5JXR), which became available during the revision of this study, is shown in red. (B) Predicted docking interface (blue) of the AutoN-AcidicN peptide in the structural model of ISWI. During docking, both Lobe 1 and Lobe 2 were present (cf. the docking interface shown in Figure 4F). The acidic helix of the N-terminal chromo domains of Chd1 is shown in orange for reference. (C) Structure prediction of a peptide comprising AutoN and AcidicN (DHRHRKTEQEEDEELL) by PEP-FOLD and I-TASSER. (D) Helical Propensity of amino acids 23–112 of ISWI predicted by four different algorithms (see legend).