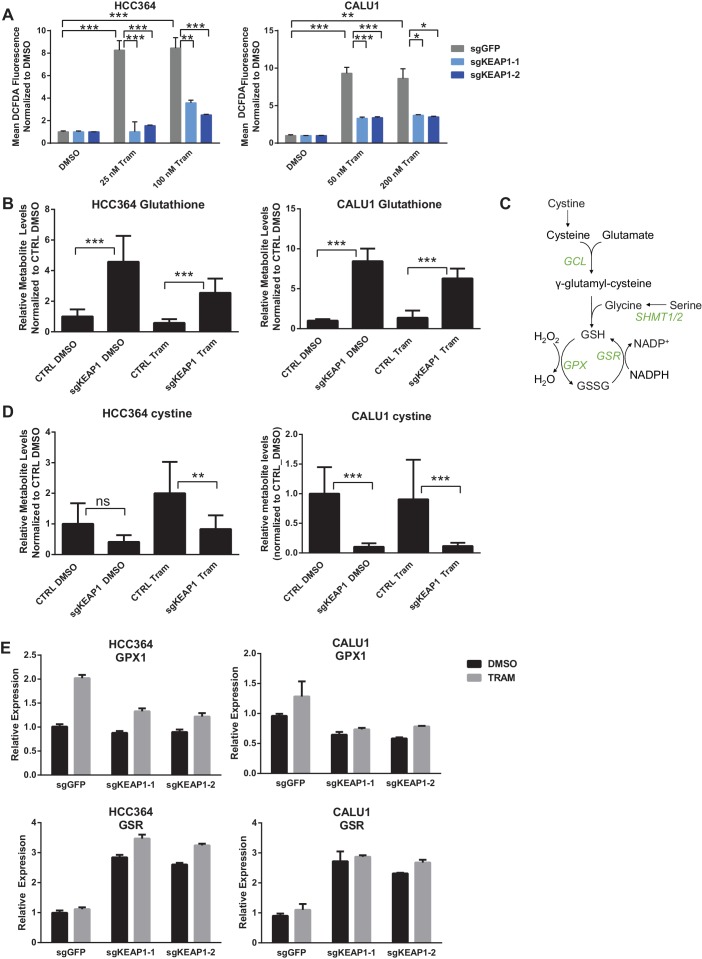
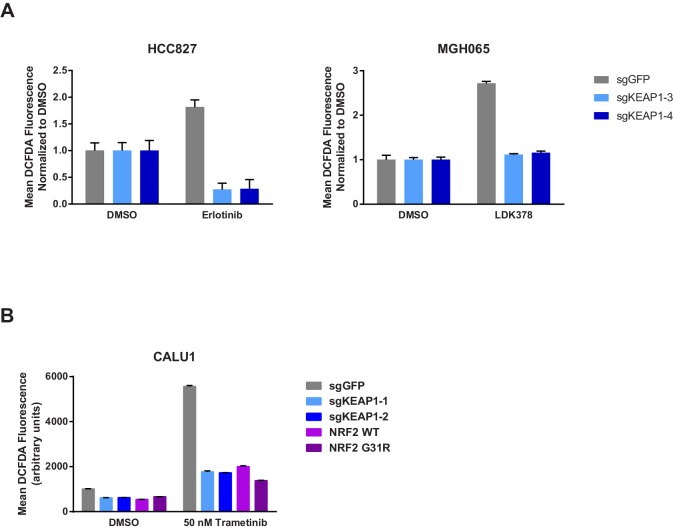
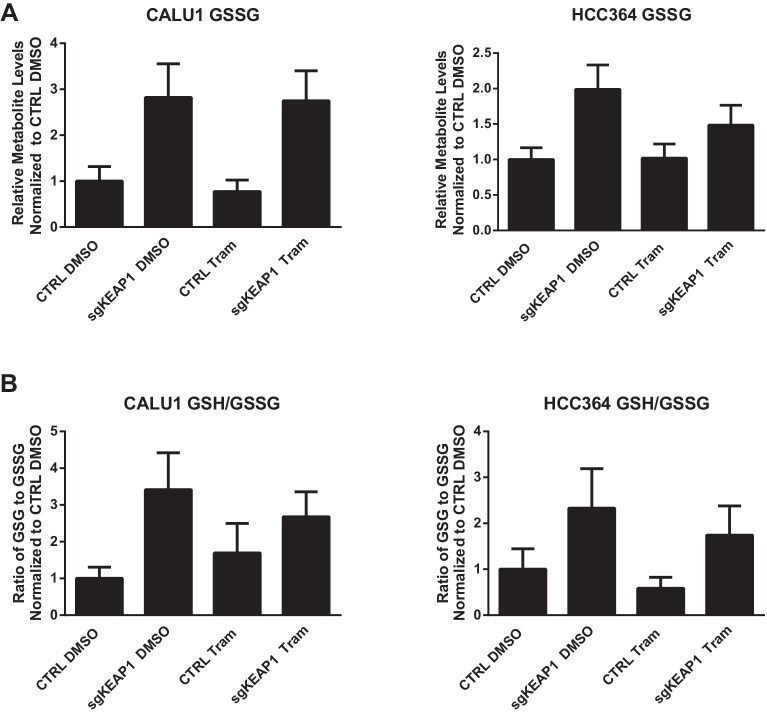
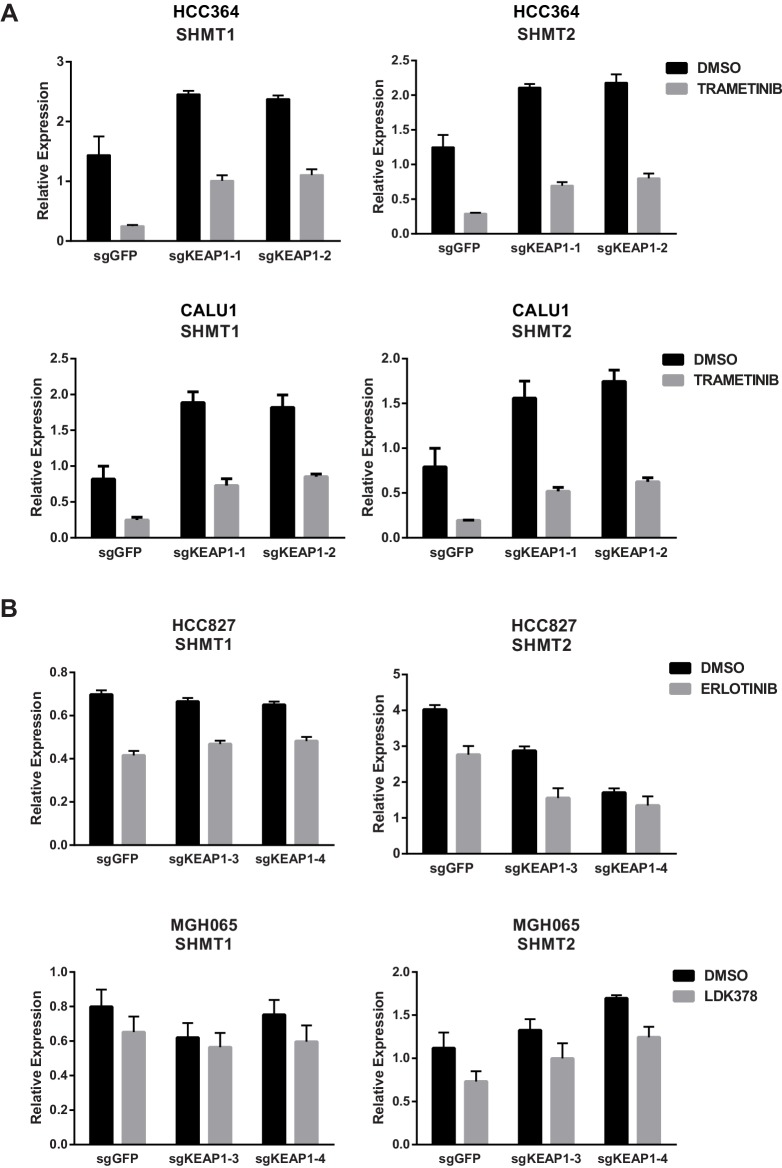
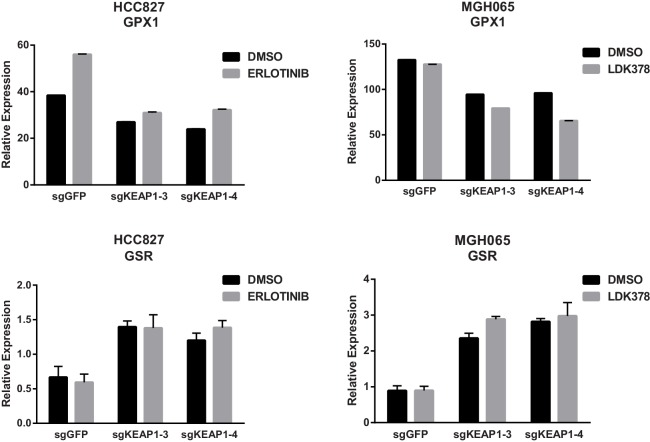
Figure 4. KEAP1-KO reduces trametinib-induced ROS through increased glutathione synthesis.
(A) HCC364 or CALU1 cells were treated with DMSO or trametinib for 72 hr. ROS was measured by DCFDA fluorescence. Error bars represent SD of the mean of two biological replicates. (B, D) CALU1 or HCC364 cells were treated with DMSO or trametinib for 72 hr and metabolites were measured by liquid chromatography tandem mass spectrometry. Error bars represent SD of eight replicates. (C) Glutathione synthesis pathway. (E) Expression of GPX1 and GSR in HCC364 and CALU1 cells treated with DMSO or trametinib for 72 hr. Error bars represent the SD of the mean of three biological replicates. ***p<0.005, **p<0.01, *p<0.02.

