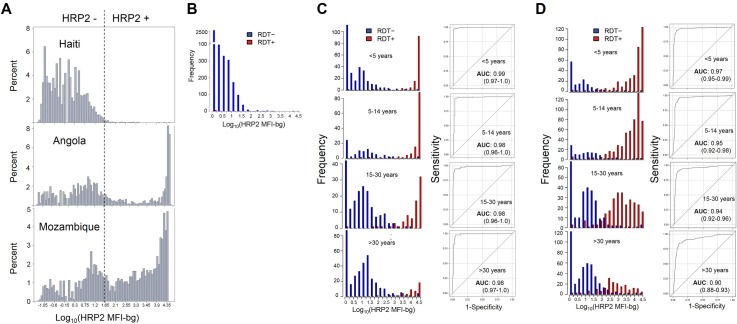
Fig 4. Distribution of HRP2 bead assay signal intensity by RDT result in different populations.
(A) MFI-bg signal at log scale for entire Haiti, Angola, and Mozambique study populations. In order to show entire range of signal distribution, any sample which gave MFI-bg signal below zero had log taken of absolute value and then multiplied by -1, making negative values possible. Signal distributions by RDT test positivity given at the time of DBS sample collection for Haiti (B), Angola (C), Mozambique (D) surveys, with Angola and Mozambique populations providing enough RDT positives to allow for age categorization. For each age category, the bead assay was assessed at the novel classification predictor by ROC analysis and calculation of area under the curve.

