. 2017 Feb 13;6:e22474. doi: 10.7554/eLife.22474

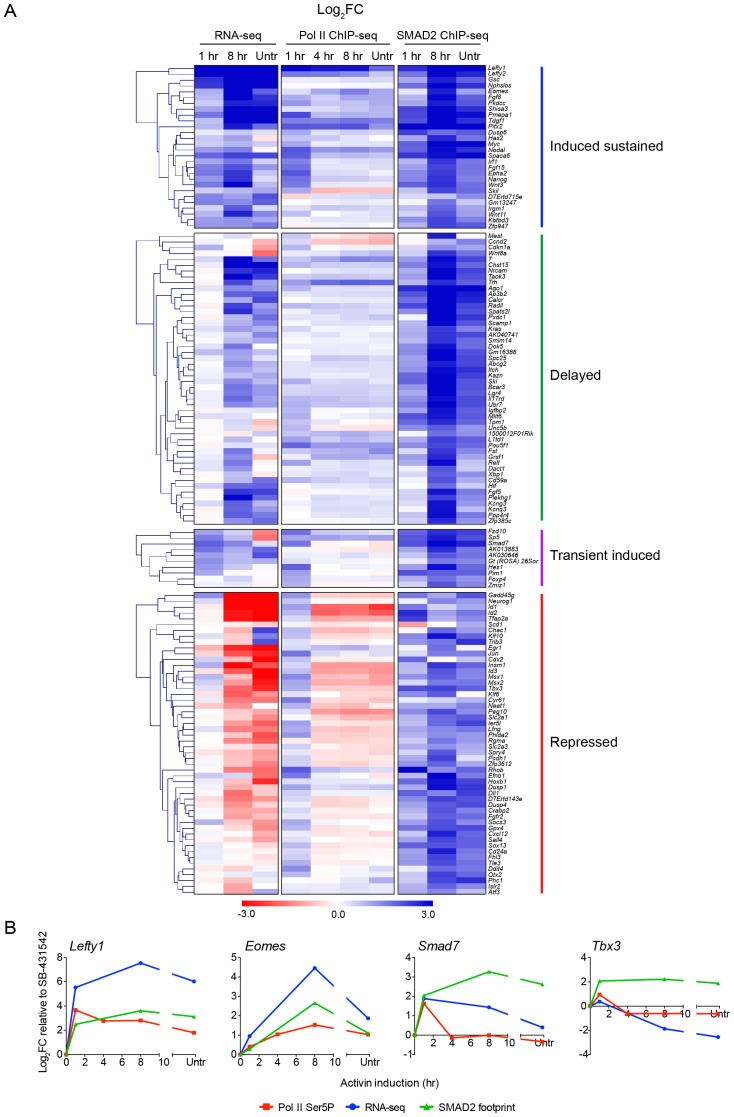
Figure 4. Localized SMAD2 chromatin binding does not directly correlate with transcription.

(A) Hierarchically-clustered heatmaps for each of the four different kinetic groups of target genes showing log2FC values relative to SB-431542 for gene expression as determined by RNA-seq (left), mean normalized read depth for Pol II Ser5P (middle) and SMAD2 footprint (right). Untr, untreated. (B) Transcriptional dynamics of different target genes (Lefty1, Eomes, Smad7, Tbx3). (For IGV browser displays, see Figure 2A and Figure 4—figure supplement 1). Plotted are quantifications of transcript levels obtained by RNA-seq, Pol II Ser5P occupancy expressed as mean normalized read depth, and SMAD2 footprint, all depicted as log2FC relative to SB-431542. Untr, untreated.

DOI: http://dx.doi.org/10.7554/eLife.22474.012

Figure 4.

Figure 4—figure supplement 1. IGV browser displays of genes and associated peaks showing differential transcription and SMAD2 binding dynamics.

Figure 4—figure supplement 1.

(AC) IGV browser displays over the transiently induced gene Smad7 (A), Eomes (B) that is induced with delayed kinetics, and Tbx3 (C) which is a gene containing peaks which are more highly enriched at 1 hr than at 8 hr. The tracks and MACS-called peaks for SMAD2, and tracks for Pol II Ser5P are shown. Denoted underneath each panel is the SBS, for which primers were designed for ChIP-PCR. (D) SMAD2 ChIP-PCR performed on SBSs surrounding the indicated genes in the conditions shown. Neg ctrl, negative control. Plotted are the means and SEM of three independent experiments. n.s., not significant; **** corresponds to a p-value of <0.0001; *** corresponds to a p-value of <0.001; ** corresponds to a p-value of <0.01.