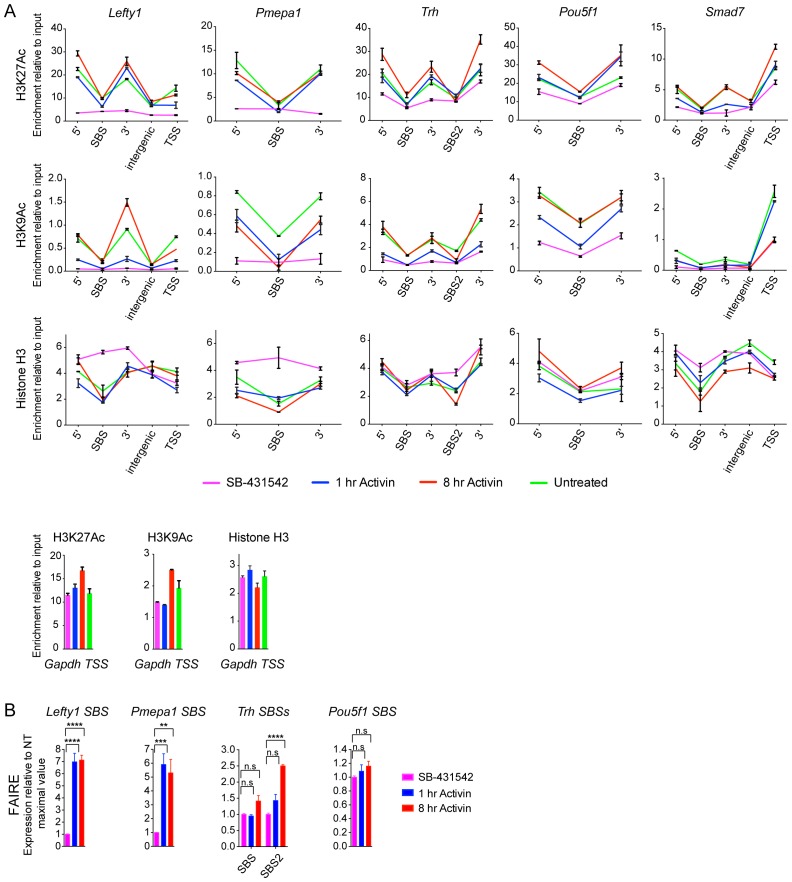
Figure 5. Changes in chromatin landscape around SBSs in response to signaling.
(A) IGV browser displays for the Lefty1 and Pou5f1 loci displaying ChIP-seq tracks for SMAD2, H3K9Ac, H3K27Ac and total histone H3 for the indicated treatments. For the SMAD2 ChIP-seq the MACS-called peaks are also shown. (B) Metaprofiles denoting coverage of total histone H3, H3K27Ac and H3K9Ac in a 5 kb window surrounding the average summit across SMAD2 consensus peaks. Each line within a plot traces the normalized read depth of H3 or acetylated H3 for each treatment. The left panels show metaprofiles for all 478 SMAD2 peaks, while the other panels only show those regions found near genes which are induced from an ‘on’ baseline or from an ‘off’ baseline. The right panels show metaprofiles for the subset of SMAD2 peaks which is associated with genes induced from an ‘off’ baseline and show changes in H3Ac enrichment from a low baseline as defined in Figure 6D. (C) Correlation plots showing normalized read depth (Log2) (left graph) or log2FC relative to SB-431542 (right graph) for H3K27Ac and H3K9Ac values, detected in the 1 hr Activin sample. (D) ChIP-PCR on the nucleosomes flanking the Lefty1 SBS (A) for H3K18Ac and H3K23Ac in P19 cells treated as indicated. Plotted are the means and SEM of three independent experiments. (E) ChIP-PCR showing enrichment of both SMAD2 and EP300 at the Lefty1 SBS in P19s treated as indicated. Plotted are the means and SEM of four independent experiments. (F) FAIRE-ChIP was performed on SB-431542, 1 hr Activin or 8 hr Activin-treated P19 cells. Soluble chromatin fractions were assayed for enrichment of the specific regions indicated which are highlighted in the IGV browser displays in panel (A) and Figure 2—figure supplement 1 and Figure 5—figure supplement 1. A representative experiment in shown (means ± SD). See Figure 5—figure supplement 1B for the averages of the three experiments and the statistical analyses. In D and E, n.s., not significant; **** corresponds to a p value of < 0.0001; *** corresponds to a p value of < 0.001 and ** corresponds to a p value of < 0.01.
DOI: http://dx.doi.org/10.7554/eLife.22474.014


