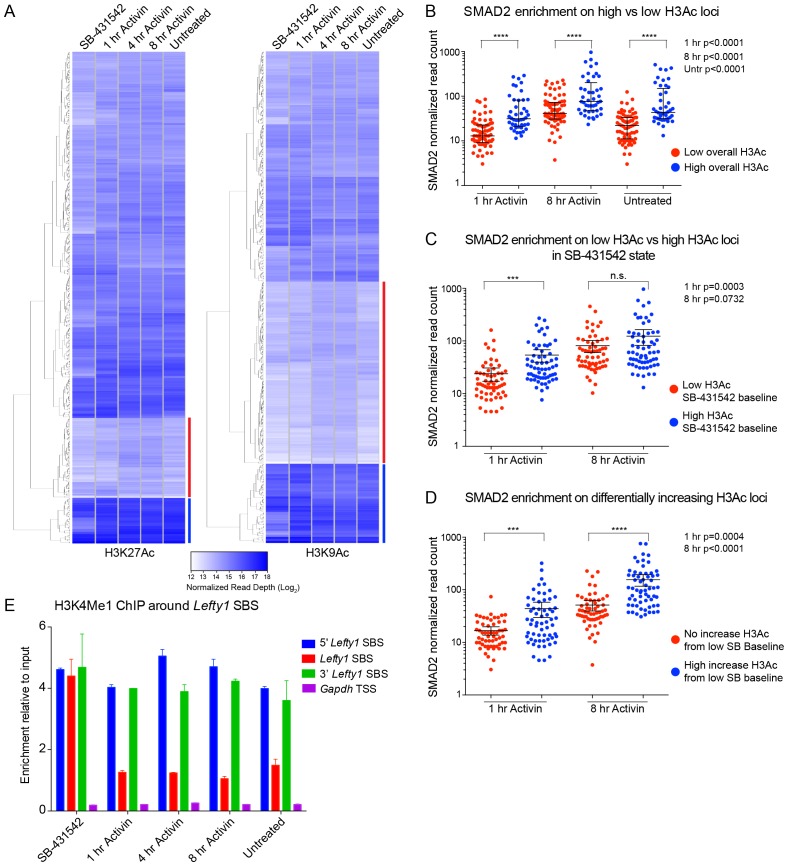
Figure 6. Relationship between chromatin state and SMAD2 binding strength.
(A) Hierarchical clustering of average read intensity (Log2) over a 5 kb window surrounding all SMAD2 consensus peak summits for each indicated treatment is shown for H3K27Ac (left panel) and H3K9Ac (right panel). Red line, peaks associated with low overall acetylation; blue line, peaks found in highly acetylated chromatin. (B–D) Correlation between normalized SMAD2 read counts and H3 acetylation state. The SMAD2 read counts over consensus peaks in either the ‘low overall acetylation’ (red) or ‘high overall acetylation’ (blue) category were plotted for the three conditions (B). The SMAD2 read counts over consensus peaks that were defined as either low H3Ac or high H3Ac in the SB-431542 state were plotted for the 1 hr and 8 hr Activin conditions (C). The SMAD2 read counts over subsets of loci selected based on changes in H3Ac enrichment from a low baseline (D). In all cases the black bars indicate the mean and 95% confidence interval. n.s., not significant. The p-values are given in the plots. (E) ChIP-PCR for H3K4Me1 for the nucleosomes at and flanking the Lefty1 SBS or a control region within the Gapdh coding locus. A representative experiment is shown (means ± SD).
DOI: http://dx.doi.org/10.7554/eLife.22474.019

