. 2017 Feb 13;6:e22474. doi: 10.7554/eLife.22474

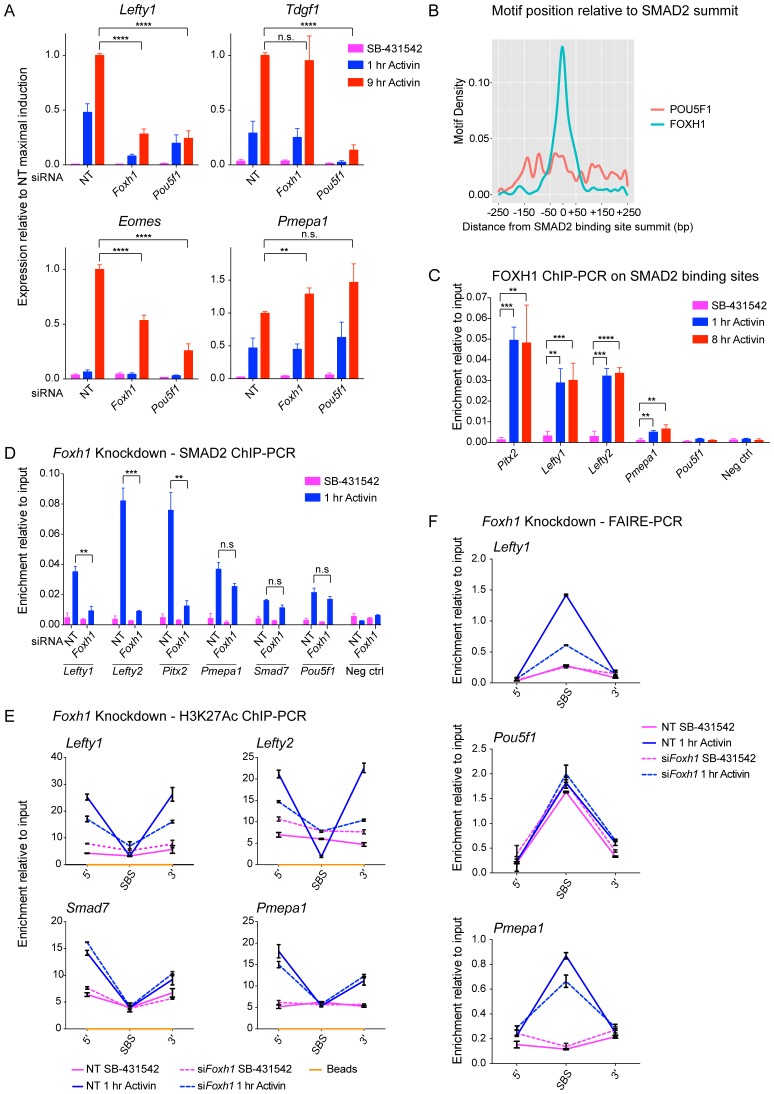
Figure 7. FOXH1 is required for SMAD2 recruitment and nucleosome remodeling at a subset of Activin target genes.

(A) P19 cells were transfected with siRNAs directed against either Pou5f1 or Foxh1, along with a non-targeting control (NT). Following signal inhibition or Activin induction, qPCR was performed for the genes shown. Plotted are the means and SEM of three independent experiments performed in duplicate of gene expression values normalized to endogenous Gapdh values. (B) The position of FOXH1 or POU5F1 motifs (regardless of orientation or strand) was plotted relative to the summit of all the peaks used in Figure 7—figure supplement 1A. (C) ChIP-PCR for FOXH1 at the indicated SBSs and negative control (Neg ctrl) region using P19 cells in the conditions shown. Plotted are the means and SEM of two independent experiments performed in duplicate. (D–F) P19 cells were transfected with either non-targeting (NT) or Foxh1 siRNAs, which were then signal inhibited (SB-431542) or stimulated with Activin for 1 hr after SB-431542 washout. They were assayed for SMAD2 ChIP-PCR (D), H3K27Ac ChIP-PCR (E) or FAIRE-PCR (F) on the selected SBSs indicated. Plotted in D are the means and SEM of three independent experiments. Neg ctrl, negative control. The data in E and F are from a representative experiment of three (means ± SD). See Figure 7—figure supplement 4 for the averages of the three experiments and the statistical analyses. In A, C and D, n.s., not significant; **** corresponds to a p value of < 0.0001; *** corresponds to p value of < 0.001; ** corresponds to a p value of < 0.01.

DOI: http://dx.doi.org/10.7554/eLife.22474.021

Figure 7—source data 1. The position of FOXH1 or POU5F1 motifs relative to the summit of all the consensus peaks.
DOI: 10.7554/eLife.22474.022

Figure 7.

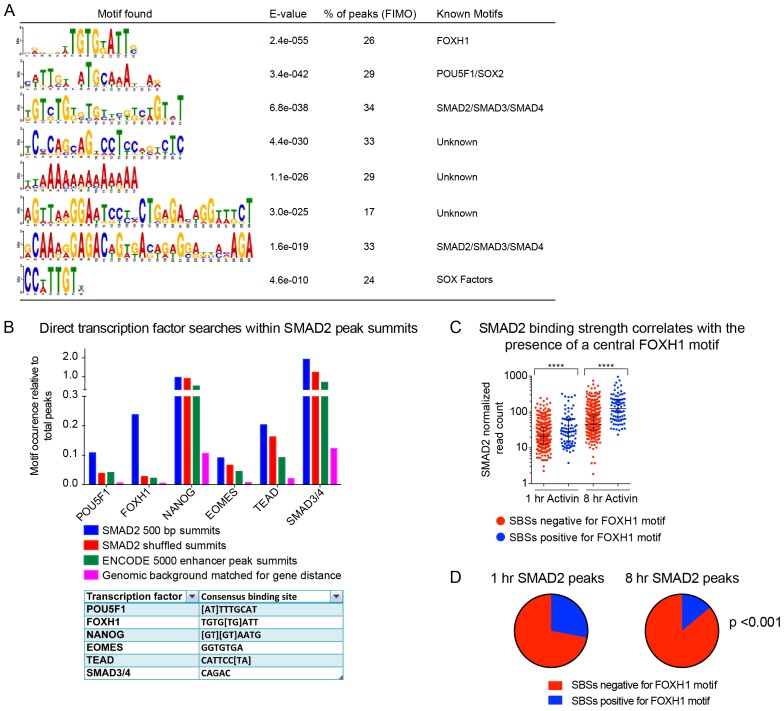
Figure 7—figure supplement 1. TF binding sites under SMAD2 peaks.

Figure 7—figure supplement 1.

(A) The top most enriched known and de novo motifs as obtained from a MEME-ChIP analysis on all SMAD2 peaks in the high confidence dataset. From the 478 consensus peaks found surrounding regulated genes, the 500 bp summit of each contributing MACS peak was taken and submitted as input, comprising a total of 757 MACS peak summits. E-values, % of peaks containing the different motifs and matching TFs are indicated. (B) Directed motif searches using the Fuzznuc program were carried out on the 500 bp summits of 757 MACS peaks as in A. In the table (bottom) the search strings are displayed for POU5F1, FOXH1, NANOG, EOMES, TEAD and the SMAD binding element itself. The total motif identifications per factor are quantified relative to the total number of peaks in the input. The blue bar denotes the amount of motifs found in the SMAD2 target gene list, whilst the other three datasets represent different background datasets, see Methods for details. (C) The 478 SMAD2 consensus peaks were separated based on the presence (blue) or absence (red) of the FOXH1 motif in a 100 bp window centered on the consensus peak summit. FIMO software with standard settings was used to detect the FOXH1 motif. The SMAD2 read counts over consensus peaks in the two categories were plotted for the 1 hr and 8 hr Activin conditions. In all cases the black bars indicate the mean and 95% confidence interval. ****, p-value <0.0001. (D) The 478 SMAD2 consensus peaks were classified based on the presence of a contributing MACS peak at 1 hr or 8 hr of Activin treatment (see Supplementary file 1). For the two groups, the percentage of peaks which have a FOXH1 motif in a 100 bp window centered on the consensus peak summit is reported in blue. Note that this percentage is significantly different between the 1 hr group and the 8 hr group. The p-value was calculated using an un-paired Chi-square test, 95% confidence interval.
Figure 7—figure supplement 2. The role of FOXH1 in SMAD2-mediated transcription.

Figure 7—figure supplement 2.

(A) For experiment shown in Figure 7A, where gene expression following siRNA-mediated knockdown of Foxh1 or Pou5f1 was assessed, qPCR was performed on the untreated samples to determine expression levels of Pou5f1 and Foxh1 itself, as quantified relative to endogenous Gapdh. Means ± SEM of three independent experiments performed in duplicate are shown. NT, non-targeting. (B) Lysates were collected from wild type P19 cells or P19 cells stably expressing MYC-tagged FOXH1, treated for the indicated times with either 20 ng/ml Activin and/or 10 µM SB-431542. Shown are Western blots for MYC, pSMAD2 and MCM6 (loading). Note that expression of MYC-FOXH1 does not alter the kinetics of pSMAD2 induction. (C) qPCR for Foxh1 was performed on samples collected from either wild type P19 cells or P19 cells stably expressing MYC-tagged FOXH1 as in (B), treated as indicated. Shown are expression levels of Foxh1 determined relative to Gapdh. Note that MYC-FOXH1 is expressed at roughly endogenous levels. A representative experiment (means ± SD) is shown. (D) ChIP-PCR for MYC-FOXH1 at the indicated SBSs and negative control (Neg ctrl) region using the P19 cells stably expressing MYC-tagged FOXH1 as in (B) in the conditions shown. A representative experiment (means ± SD) is shown. (E) qPCR for Foxh1 performed on non-targeting (NT) control or Foxh1 siRNA-transfected cells used for the experiments shown in Figure 7D–F to show the efficiency of knockdown. Values were normalized to endogenous Gapdh. A representative experiment (means ± SD) is shown. (F) A control H3K27Ac ChIP-PCR on the Gapdh TSS from the samples used in Figure 7E. A representative experiment (means ± SD) is shown.
Figure 7—figure supplement 3. Characterization of the in-house anti FOXH1 antibody.

Figure 7—figure supplement 3.

Lysates were collected from wild type P19 cells transfected with either non-targeting (NT) or Foxh1 siRNAs and from P19 cells stably expressing MYC-tagged FOXH1 (see Figure 7—figure supplement 2B–D). Shown are Western blots for FOXH1, MYC and TUBULIN (loading). Note that a band at the predicted molecular size of FOXH1 is detected in the P19 MYC-FOXH1 sample when incubating the blot with either the in-house anti FOXH1 antibody (left panel) or an anti MYC antibody (right panel). No bands are detected in wild type P19 samples by anti FOXH1 in-house antibody. Thus the in house anti FOXH1 antibody detects MYC-tagged FOXH1, but not endogenous FOXH1 in Western blot analysis.
Figure 7—figure supplement 4. The role of FOXH1 in SMAD2-mediated chromatin remodeling.

Figure 7—figure supplement 4.

(A and B) P19 cells were transfected with either non-targeting (NT) or Foxh1 siRNAs, and were then signal inhibited (SB-431542) or stimulated with Activin for 1 hr after SB-431542 washout. The nucleosomes flanking or at selected SBSs were assayed for H3K27Ac enrichment by ChIP-PCR (A) or assayed for FAIRE-PCR (B). Plotted are the means and SEM of three independent experiments performed in duplicate. n.s., not significant. **** corresponds to a p value of < 0.0001, *** corresponds to a p value of < 0.001, ** corresponds to a p value of < 0.01.