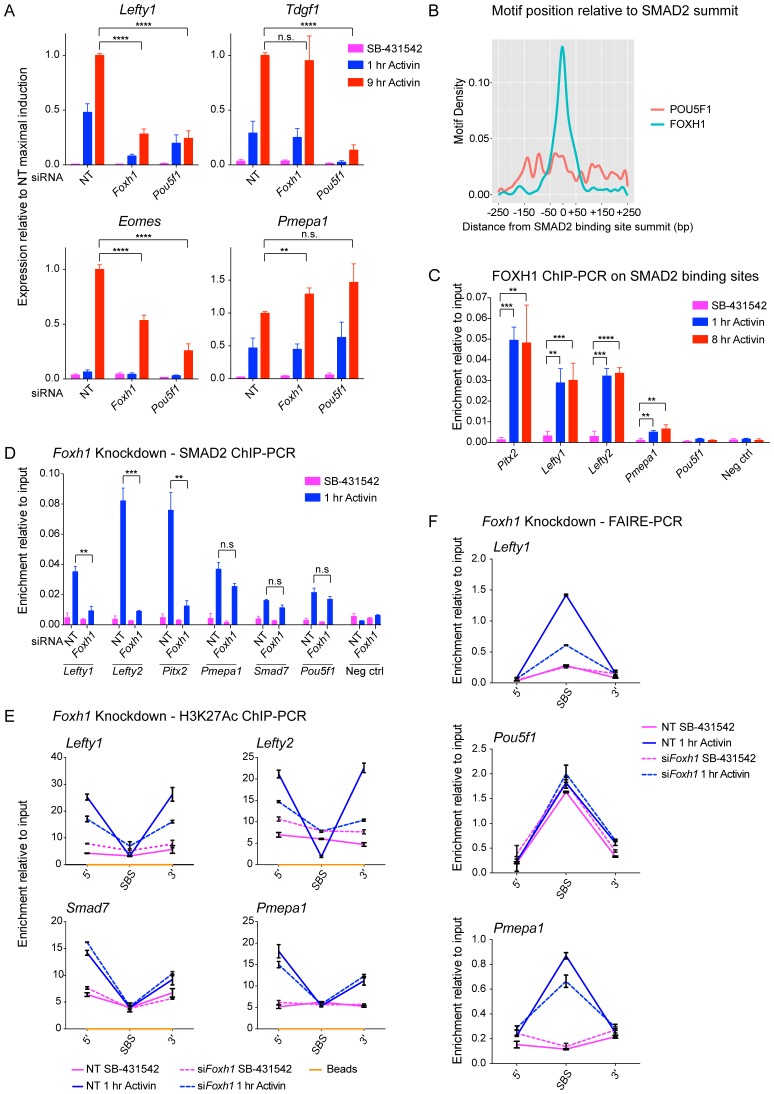
Figure 7. FOXH1 is required for SMAD2 recruitment and nucleosome remodeling at a subset of Activin target genes.
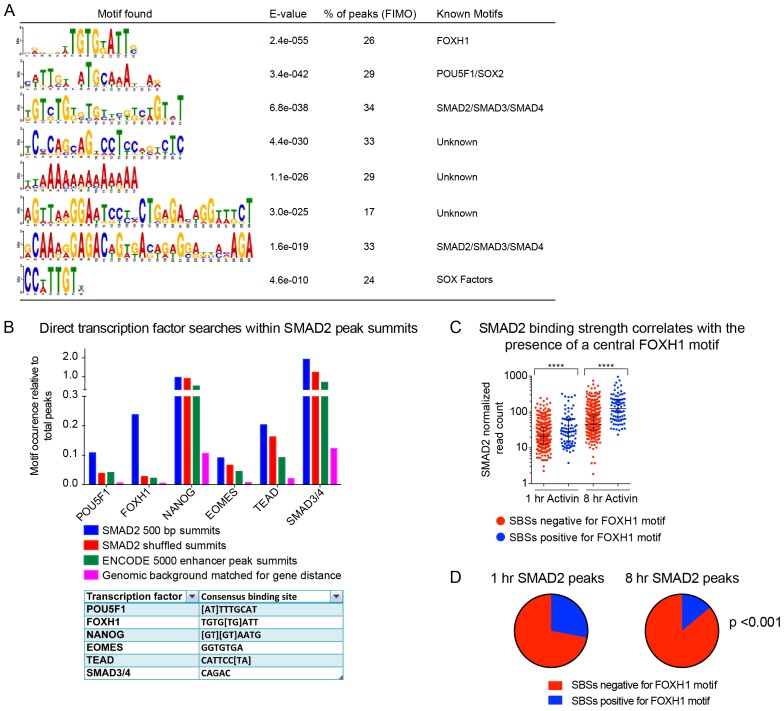
(A) P19 cells were transfected with siRNAs directed against either Pou5f1 or Foxh1, along with a non-targeting control (NT). Following signal inhibition or Activin induction, qPCR was performed for the genes shown. Plotted are the means and SEM of three independent experiments performed in duplicate of gene expression values normalized to endogenous Gapdh values. (B) The position of FOXH1 or POU5F1 motifs (regardless of orientation or strand) was plotted relative to the summit of all the peaks used in Figure 7—figure supplement 1A. (C) ChIP-PCR for FOXH1 at the indicated SBSs and negative control (Neg ctrl) region using P19 cells in the conditions shown. Plotted are the means and SEM of two independent experiments performed in duplicate. (D–F) P19 cells were transfected with either non-targeting (NT) or Foxh1 siRNAs, which were then signal inhibited (SB-431542) or stimulated with Activin for 1 hr after SB-431542 washout. They were assayed for SMAD2 ChIP-PCR (D), H3K27Ac ChIP-PCR (E) or FAIRE-PCR (F) on the selected SBSs indicated. Plotted in D are the means and SEM of three independent experiments. Neg ctrl, negative control. The data in E and F are from a representative experiment of three (means ± SD). See Figure 7—figure supplement 4 for the averages of the three experiments and the statistical analyses. In A, C and D, n.s., not significant; **** corresponds to a p value of < 0.0001; *** corresponds to p value of < 0.001; ** corresponds to a p value of < 0.01.
DOI: http://dx.doi.org/10.7554/eLife.22474.021


