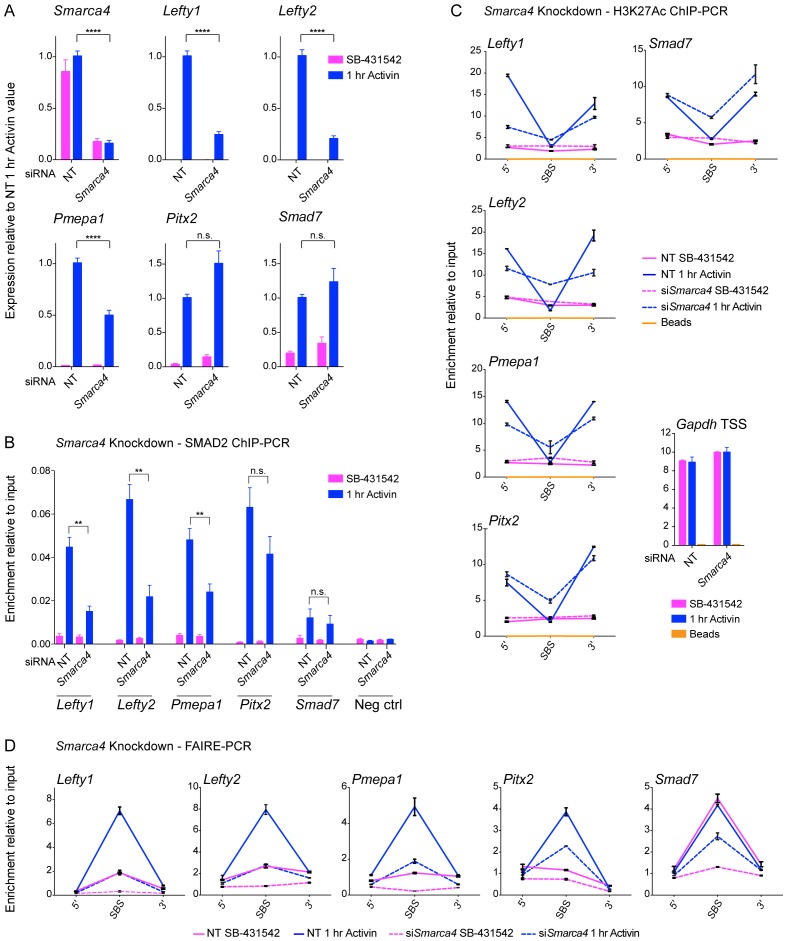
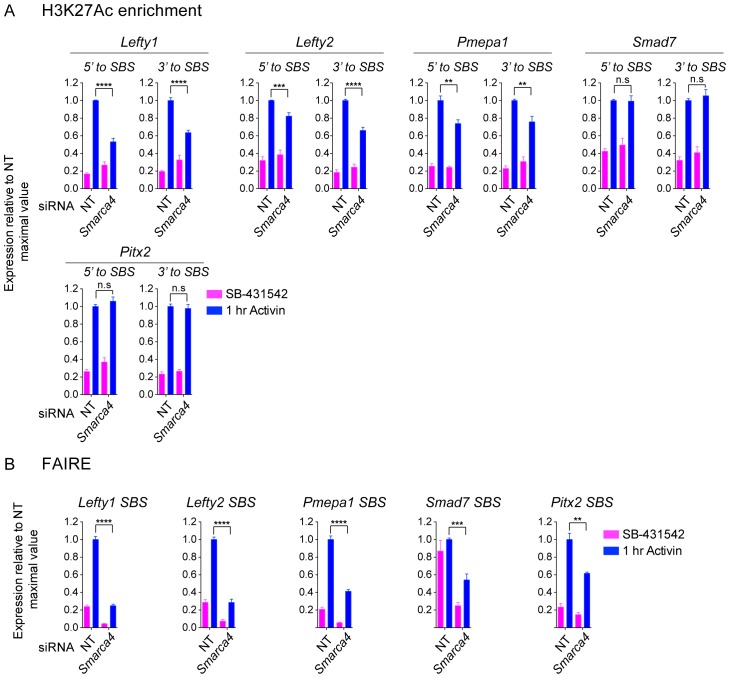
Figure 8. SMARCA4 is required for SMAD2 binding, nucleosome eviction and histone acetylation at a subset of Activin target genes.
(A) P19 cells were transfected with either non-targeting (NT) or Smarca4 siRNAs. Cells were then signal inhibited (SB-431542) or stimulated with Activin for 1 hr after SB-431542 washout. They were assayed for transcription by qPCR. The data shown are means ± SEM from four independent experiments. (B–D). Samples were prepared as for A and assayed for SMAD2 ChIP-PCR (B), H3K27Ac ChIP-PCR (C), or FAIRE-PCR (D) on the selected SBSs indicated. Plotted in B are the means and SEM of four independent experiments. Neg ctrl, negative control. The data in C and D are from a representative experiment of three (means ± SD). See Figure 8—figure supplement 1 for the averages of the three experiments and the statistical analyses. In A and B, **** corresponds to a p value of < 0.0001. ** corresponds to a p value of < 0.01; n.s., not significant.


