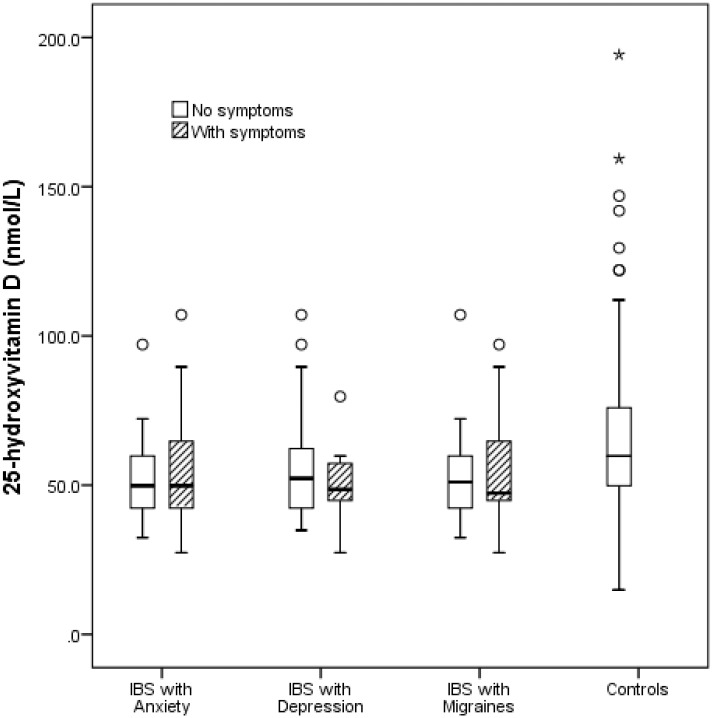
Fig 2. Boxplot of the comparison of 25(OH)D concentrations between the controls and IBS subjects with psychosomatic manifestations.
This figure shows a significant difference in serum 25(OH)D between the 4 groups: IBS subjects with anxiety (n = 17), IBS subjects with depression (n = 14), and IBS subjects with migraines (n = 13), and the controls, (ANOVA, p = 0.004). Post hoc analysis revealed a significant difference in 25(OH)D between the controls and subjects with IBS and migraines (p = 0.01), but not for IBS patients with depression (p = 0.08), or IBS patients with anxiety (p = 0.44). Hatched boxes represent subjects with symptoms, while clear boxes represent subjects with no symptoms. Circles and asterisks represent standard deviations.

