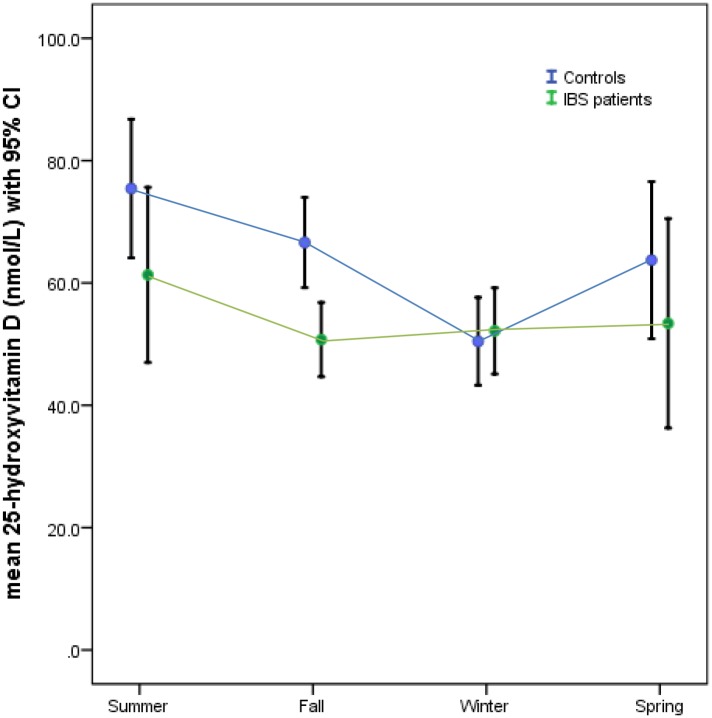
Fig 3. Graph of the relationship between the seasons and serum 25(OH)D concentration in patients with IBS and controls.
Serum 25(OH)D was significantly lower in the subjects with IBS compared to controls (ANOVA, p = 0.04). Both groups had higher serum concentration of 25(OH)D in the summer compared to winter (ANOVA, p = 0.04). There were no interactions between the groups and seasons (ANOVA, p = 0.24).

