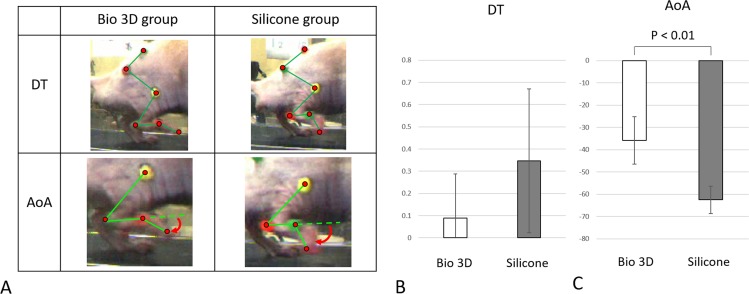
Fig 3. Kinematic studies.
A: The photographs demonstrate drag toe (DT) and angle of attack (AoA) in both Bio 3D and silicone groups. In the silicone group, the rat’s toe was not off the ground. The red curved arrows represent the AoA. B: Regarding the DT, there was no significant difference among two groups. C: AoA was significantly different between the two groups (p < 0.01). Error bars represent the standard deviation.

