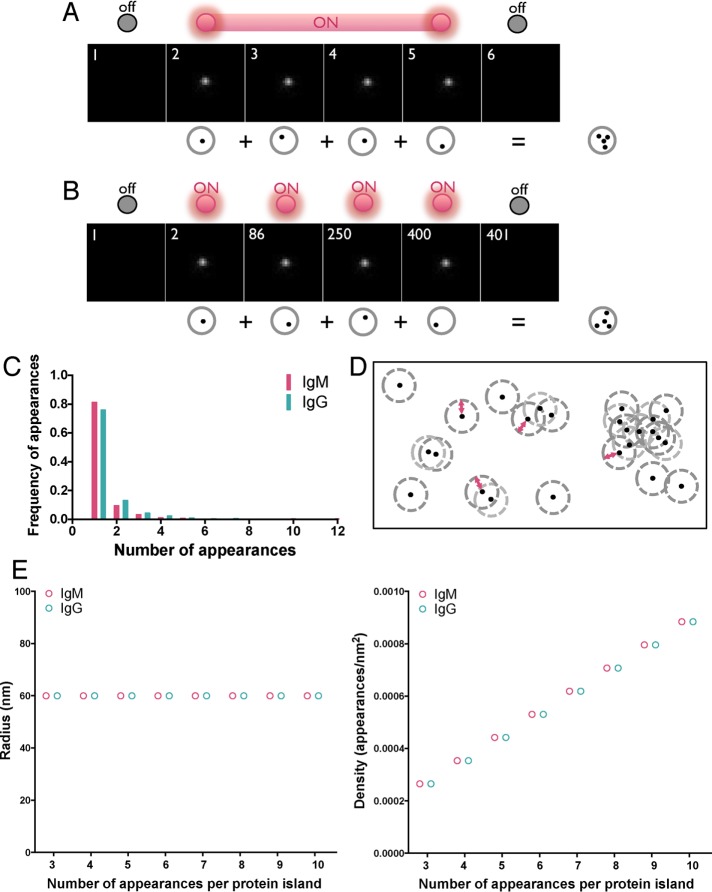
FIGURE 2:
Strategy for identifying protein islands. (A, B) Human peripheral blood B-cells were labeled with Alexa Fluor 647–Fab anti-IgM or -IgG at a low concentration (10 nM) to ensure spatially and temporally well separated detection of single BCRs within the imaging area (2.4 μm × 2.4 μm) and dSTORM images were acquired. (A) Example of a single fluorophore detected in consecutive frames when the fluorescence emission from a single fluorophore is interrupted by the acquisition time. Frames in the sequence with no signal represent times when the molecule is in the dark state. (B) A second example, showing a single fluorophore detected in multiple frames by irregular intervals. Multiple appearances of a single fluorophore in both cases result in clusters of peaks originating from a single molecule. (C) Frequency of appearances of Alexa Fluor 647–Fab anti-IgM and -IgG under the foregoing conditions. (D) Representative diagram showing spatially isolated assemblies of proteins containing single and multiple receptors defined by the Hoshen–Kopelman algorithm–based cluster analysis detailed in Materials and Methods. Red arrowed line denotes 60-nm radius. (E) Radius (left) and density (right) of spatially isolated assemblies of appearances (protein island) plotted as a function of protein islands containing 3–10 appearances. Protein islands containing two appearances are excluded from these graphs because two appearances cannot define an area.

