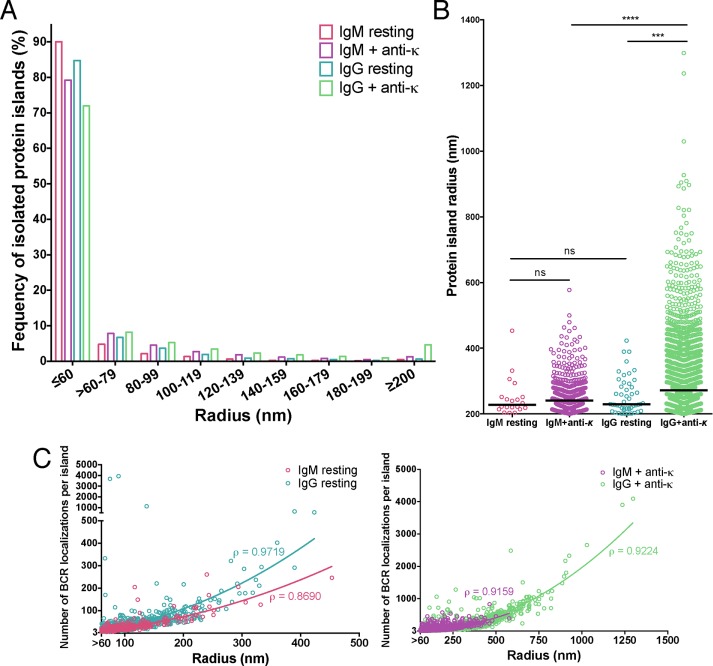
FIGURE 5:
Size of IgM and IgG BCR protein islands in B-cells on nonactivating and activating bilayers. (A) Distribution of protein island radius. Protein islands with <60 and >200 nm radius are categorized separately. (B) Distribution of protein island radius >200 nm. Each dot represents a single protein island. Black line, median protein island radius with r ≥ 200 nm. Data were acquired from two or three independent experiments with a minimum of 10 cells/ experiment for each condition and compared by two-tailed Mann-Whitney U test. ****p < 0.0001, ***p < 0.001; ns, nonsignificant. (C) Number of receptor localizations per protein island plotted as a function of island radius for IgM and IgG BCRs under resting and activating conditions. IgM and IgG BCR protein islands in resting (left) and anti-κ activated (right) cells. ρ is Spearman’s rank correlation coefficient. Protein islands containing dimers are excluded from these graphs because two receptors cannot define an area.

