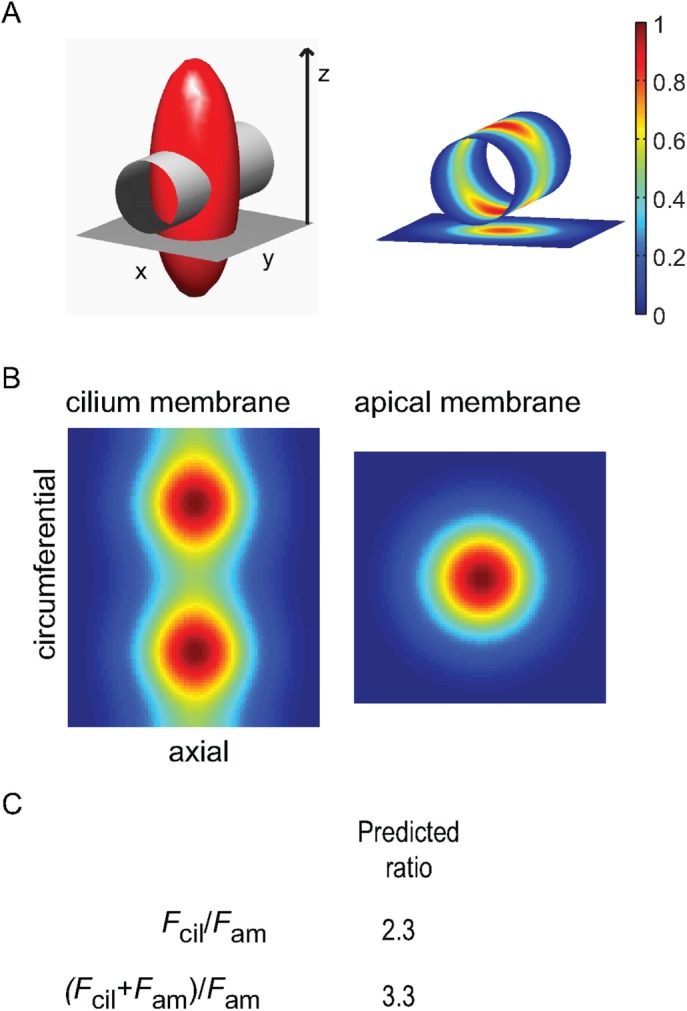
FIGURE 3:

Theoretical calculation of the threshold for ciliary enrichment. (A) Left, isointensity surface of the excitation psf (shown as (1/e)Imax; red ellipsoid) intersecting with a right circular cylinder with diameter 300 nm and length 1 μm, which represent the average cilium geometry, and a planar surface 1 μm square orthogonal to the z-axis (the optical axis, or axis of light propagation), which represents the apical membrane. Right, projected psf intensity profiles at the cylinder (cilium) and planar (apical membrane) surfaces, as obtained by coordinate interpolation. (B) Projected psf intensity profiles at the cylinder and planar surfaces shown en face, where the cylinder has been sliced along one side and laid flat. The pixel dimensions of the two surfaces are identical and set by the angular frequency of the cylinder coordinates, thus allowing direct prediction of expected fluorescence intensity ratios between the cilium and apical membranes, assuming uniform density of fluorophore, by finding the quotient of the two-dimensional integration of each profile. (C) Predicted Fcil/Fam and (Fcil+ Fam)/Fam ratios. The latter predicts that the cilium will appear more than threefold brighter than the neighboring apical membrane in raw fluorescence images when the spatial density of fluorophores is identical within the two membrane compartments.
