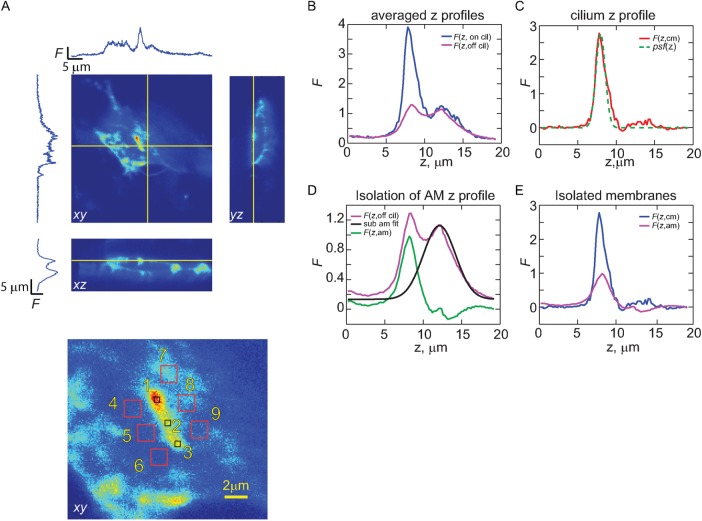
FIGURE 4:
Strategy for isolating fluorescence originating from cilia and apical membranes. (A) Representative 3D z-stack of an IMCD3 cell expressing an EGFP-tagged GPCR. Yellow lines indicate planes of the displayed xy-, xz-, and yz-images. Bottom, red numbered boxes indicate regions of interest (ROIs) where z-profiles, averaged in xy, were obtained. (B) For each cell analyzed, three ROIs were selected along the length of the cilium and six were selected from the immediate vicinity of the cilium, and the respective z-profiles were averaged to obtain F(z, on cilium) and F(z, off cilium). (C) Fluorescence z-profile for the cilium alone (Fcil), obtained by subtracting F(z, on cilium) from F(z, off cilium). Green dashed line represents the scaled z-profile of the psf. (D) To better isolate the fluorescence emanating from the apical membrane, the region of F(z, off cilium) profile distal to the apical membrane was fitted with a Gaussian function, and the resulting z-profile was subtracted to yield Fam. (E) Overlay of the isolated F(z, cm) and F(z, am).

