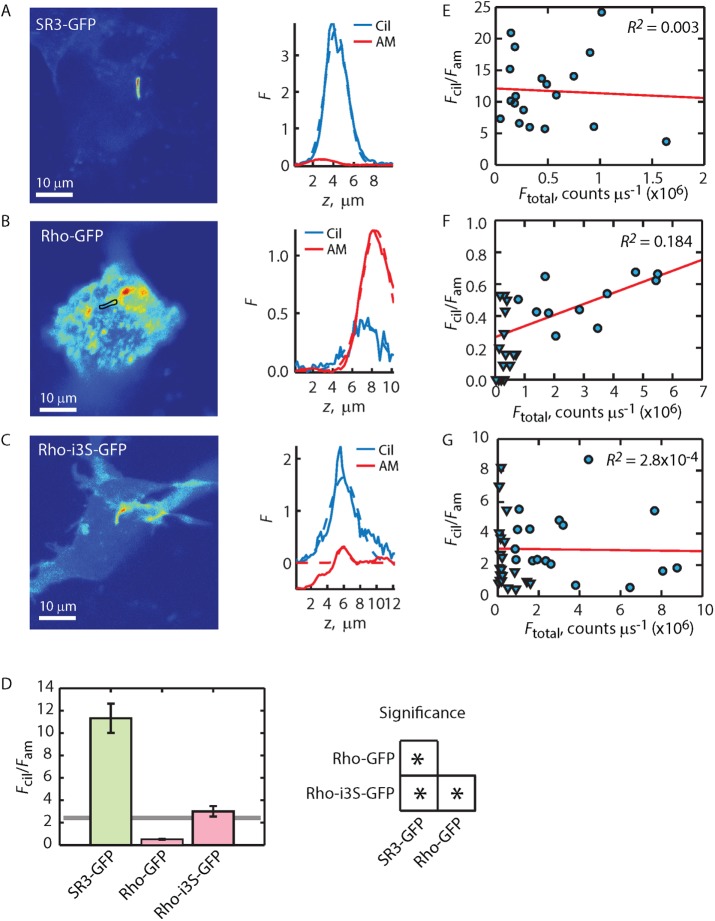
FIGURE 5:
Quantification of Fcil/Fam reveals that Rho-i3S-GFP has access to, but is not enriched within, the ciliary membrane. (A–C) Fluorescence distribution images (left) and Fcil and Fam z-profiles (right) for three GPCR constructs. Solid lines represent the z-profiles; dashed lines represent Gaussian fittings of the profiles. (D) Averaged Fcil/Fam ratios obtained from the ratios of Gaussian fitting peaks (left). Error bars represent SEM (N’s provided in Table 1). Solid horizontal line is the enrichment threshold (ET). Right, significance tests; asterisks indicate significance with p < 0.05 as determined by post hoc analysis (Materials and Methods). (E–G) Individual Fcil/Fam ratios (symbols) plotted as a function of total GPCR expression (note different axis scaling). Solid lines represent linear regressions of the relations. R2 values are the coefficients of determination and indicate goodness of fit, where R2 = 1 indicates perfect fit (Materials and Methods). Triangles in F and G represent results from cells in which the expression levels of the Rh-GFP constructs were deliberately reduced, allowing direct comparison of ciliary enrichment between Rho and SR3 constructs at similar expression levels (see the text for details).

