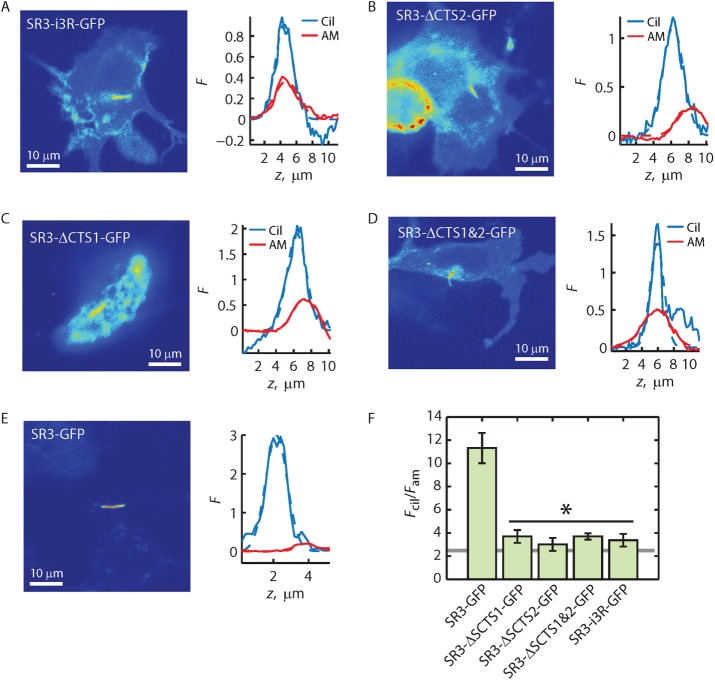
FIGURE 6:
Ax(S/A)xQ motif found in the i3 loop of Rho is not a ciliary depletion signal. (A–E) Fluorescence distribution images (left) and Fcil and Fam z-profiles (right) for the indicated GPCR constructs. Solid lines represent the z-profiles; dashed lines represent Gaussian fittings of the profiles. (F) Averaged Fcil/Fam ratios obtained from ratios of the peaks of Gaussian fittings. Error bars represent SEM (N’s provided in Table 1). Asterisk indicates that Fcil/Fam ratio for each construct under the horizontal black line is significantly less than that of SR3-GFP, with p < 0.05 as determined by post hoc analysis (Materials and Methods). Gray line indicates enrichment threshold.

