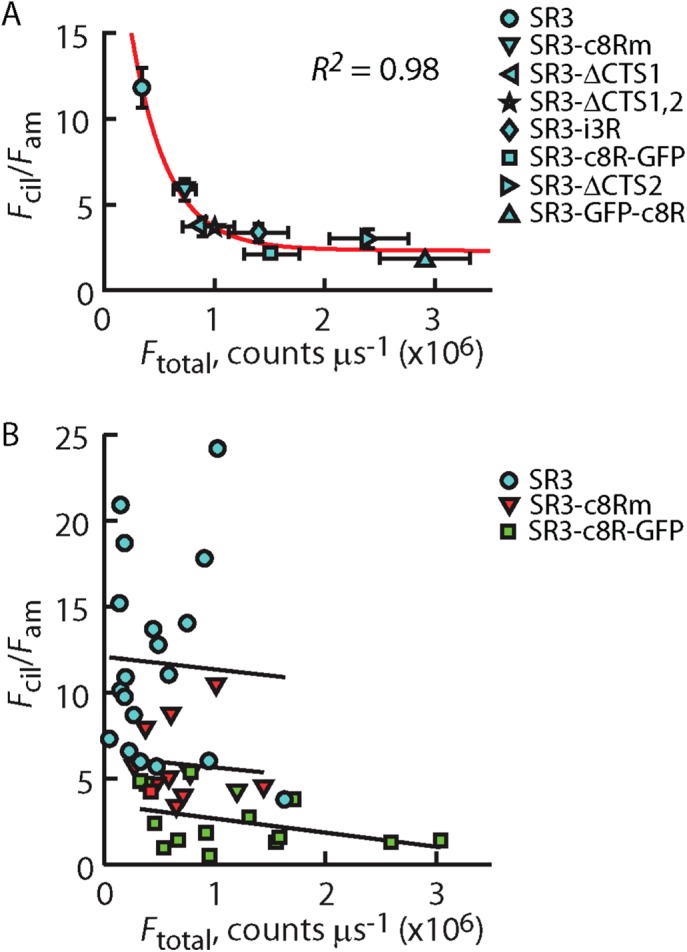
FIGURE 9:

Ciliary enrichment correlates with average overall expression levels of different SR3 constructs but not with the variation in expression within a given construct. (A) Average Fcil/Fam of indicated SR3-GFP construct plotted against the average Ftotal for that construct. Vertical and horizontal error bars represent the SEM of the Fcil/Fam ratio and the Ftotal values, respectively. Red line represents fitting of the data by an exponential function. R2 is a measure of goodness of fit. where a value of 1 indicating perfect fit. (B) Scatter of Fcil/Fam vs. Ftotal for individual cells of the indicate SR3-GFP constructs. Lines are linear regressions through each of the scatter plots, showing a lack of significant correlation between Fcil/Fam and Ftotal for any of the constructs. Data for SR3-GFP are reproduced from Figure 5E.
