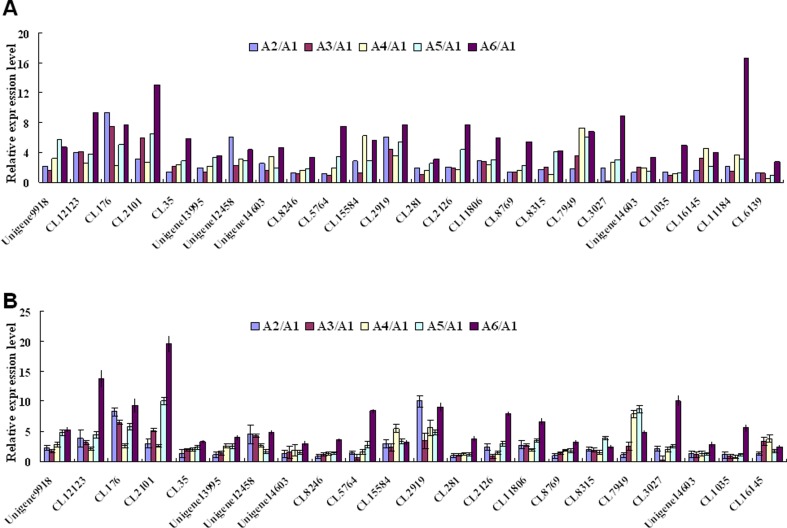
Fig 3. Expression pattern confirmation of selected genes by qRT-PCR.
(A) Changes in the relative expression levels of 24 selected genes as determined by RNA-Seq. (B) Changes in the relative expression levels of 24 selected genes as determined by qRT-PCR. The Y axis indicates the relative fold-change in transcript abundance under conditions of salt stress in relation to the control. Abbreviations indicate ‘HanYou-5HanYou-5’ under normal growth conditions (A 1), and 2 (A 2), 4 (A 3), 8 (A 4), 12 (A 5), and 24 (A 6) hours of salt stress treatment. qRT-PCR results represent mean ± standard deviation (SD) of three experimental replicates.

