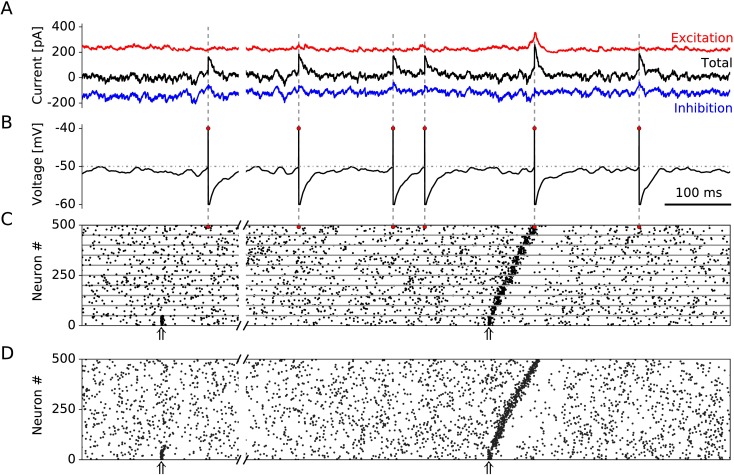
Fig 2. Example of 1 second network activity.
The first 250 ms depict the dynamics of a network with random and recurrent connections only (prc = 0.1). The same network after embedding feedforward connectivity (pff = 0.04) is shown in the last 750 ms. A: Input currents experienced by an example neuron. The excitatory and inhibitory inputs are denoted by the red and blue traces, respectively. The sum of all currents (synaptic, injected, and leak currents) is shown in black. B: Membrane potential of the same neuron. Red dots denote the time of firing. C: Raster plot of spike times of 500 neurons (50 neurons per group are shown). The red dots correspond to the firing of the example neuron in A and B. The stimulation times of the first assembly are denoted with upward arrows. D: Raster plot of a continuous sequence. Each neuron is connected to its M neighbours (in the range ) with probability prc (left-hand side); and afterwards (right-hand side), a feedforward connectivity pff to the following M neurons (in the range ) is introduced.

