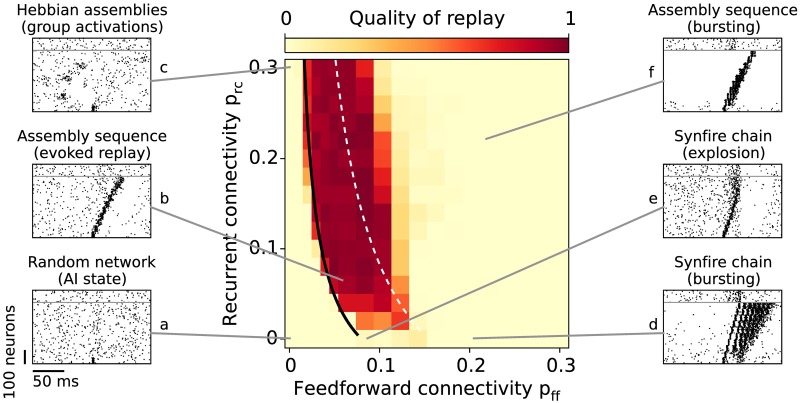
Fig 3. Evoked replay.
Assembly-sequence activation as a function of the feedforward pff and the recurrent prc connectivities. The color code denotes the quality of replay, that is, the number of subsequent groups firing without bursting (see Materials and Methods). The black curve corresponds to the critical connectivity required for a replay where the slope c of the transfer function (See Materials and Methods and Eq 1) is matched manually to fit the simulation results for connectivities prc = 0.08 and pff = 0.04. The slope c is also estimated analytically (dashed white line). The raster plots (a-f) illustrate the dynamic regimes observed for different connectivity values; neurons above the gray line belong to the background neurons.

