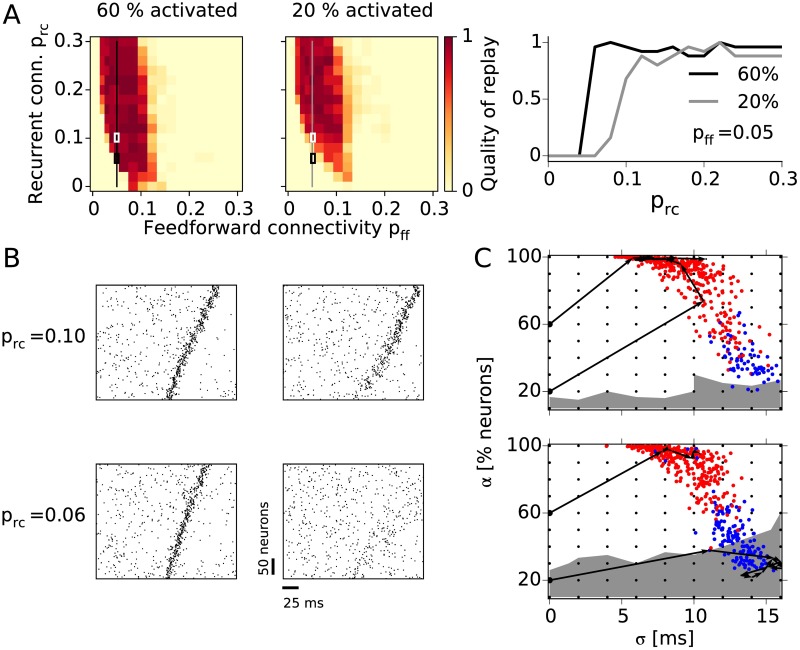
Fig 4. Pattern completion.
A: Quality of replay after partial activation of the first group for cue size 60% (left panel) and 20% (middle) as a function of feedforward and recurrent connectivity. The right-most panel shows the quality replay after a cue activation (20% and 60%) as a function of the recurrent connectivity (prc) while the feedforward connectivity is constant (pff = 0.05). B: Examples of network activity during 60% (left) and 20% (right) cue activation. The top and bottom raster plots correspond to assembly sequences with higher (prc = 0.10, top) and lower (prc = 0.06, bottom) recurrent connectivity, highlighted in A with white and black rectangles, respectively. C: State-space portraits representing the pulse-packet propagation. The activity in each group is quantified by the fraction of firing excitatory neurons (α) and the standard deviation of their spike times (σ). The initial stimulations are denoted with small black dots while the colored dots denote the response of the first group to the stimulations; red dot if the whole sequence is activated, and blue otherwise. Stimulations in the region with white background result in replays, while stimulating in the gray region results in no replay. The black arrows illustrate the evolution of pulse packets during the replays in B. Top: prc = 0.10; bottom: prc = 0.06.

