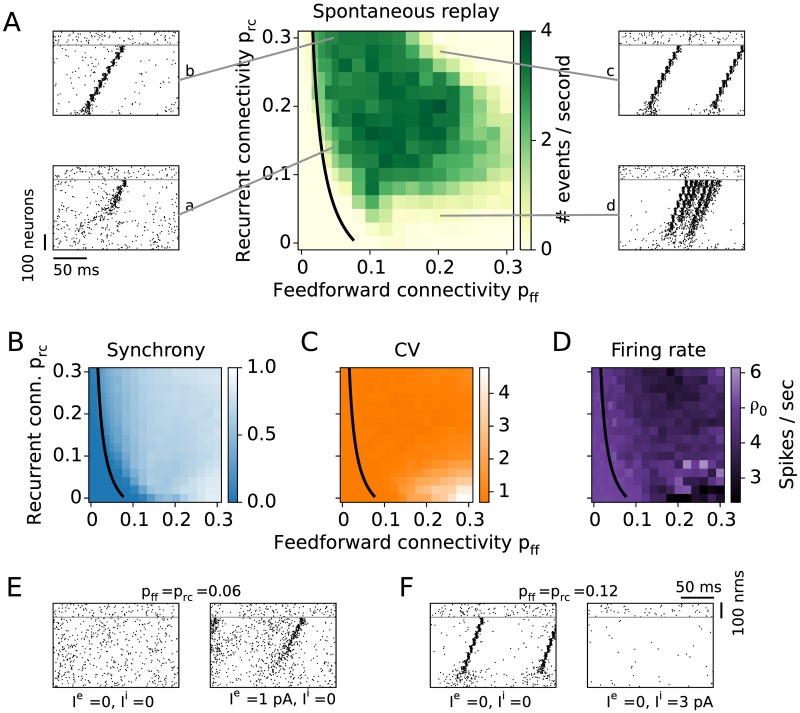
Fig 5. Spontaneous network activity.
A: The rate of spontaneous sequence activation is measured in the unperturbed network. The black curve is the analytical result for the lower bound of successful propagation from Fig 3. Examples of spontaneous replays for different connectivities are shown in the raster plots a-d. Synchrony (B), coefficient of variation (C), and firing rate (D) are averaged over the neurons in the last group of the sequence. E: Spontaneous events modulated by an external input. For low enough connectivities no spontaneous events occur (left). A small additional constant current input to the whole excitatory population (Ie = 1 pA) generates spontaneous replays (right). F: A densely connected network shows replays (left). Once the inhibitory population receives an additional constant current input (Ii = 3 pA), the firing rate decreases and no spontaneous events occur (right).

